
.svg "kloia.png")
By Serhat Düzen on Oct 8, 2026, 1:16:36 PM

Your Dashboards Are Green. Your Users Are Still Waiting.
Picture a message from support: the checkout page feels slow. You open your dashboards. Latency is flat, errors are quiet, every service is green. You answer that it looks fine on your side. Support answers that it is still slow.
You are both right. Your traces start when a request reaches a server. Your user's experience starts when they tap, and it ends when the page has stopped moving. In between sit things a server never sees: the network, the size of your JavaScript, the phone in their hand, a third-party script that hangs, a render that waits on something slow.
Measuring from inside the user's browser is called Real User Monitoring (RUM). This post explains what it is, how OpenTelemetry does it without tying you to a vendor, and walks through a hands-on lab you can run and throw away. Along the way we show how big the gap can be: in the lab, one basket request took a median of 28 ms on the server and 121 ms in the browser. Your numbers will differ. The point is that the gap exists, and that you can see it.
|
What you will get from this post. A plain-language picture of RUM; how a browser and a backend end up in one trace; a working lab with the code and config (about 35 lines per side); and a first dashboard. That is a complete, working RUM setup. A second post goes deeper, into business metrics, device and country breakdowns, and what to check before real users: you can take this one on its own. |
|
Words you will see. Trace: the story of one request, from the click to the database. Span: one step in that story, such as the browser's wait or the server's work. Collector: a small service that receives these records and passes them on. Tempo: where the traces are stored. TraceQL: the language for searching traces and turning them into graphs. p95: the wait that 95% of requests beat; the slowest 5% take longer. Apdex: a score from 0 to 1 for how fast the app felt. Session: a random visit number, not a person. |
What Real User Monitoring is
Server monitoring answers "is my system healthy?". RUM answers a different question: "what did a real person experience?". A small piece of code runs in the user's browser (or, on mobile, an SDK inside the app). It records page loads, clicks, the requests the page makes and the errors it hits, and sends them to you.
It complements synthetic monitoring, which runs scripted visits from fixed places on a schedule. Synthetic checks tell you the site is up. RUM tells you how it felt to the people who actually showed up, on their devices and networks. It only sees users who visit, and it can only record what you decide to record.
Here are questions RUM can answer. The first two are answered in this post; the rest in the follow-up:
- How long did users wait, compared with what my servers measured?
- Can people log in, and is a spike of failures a wave of wrong passwords or an outage?
- Did the app feel fast, as one number a non-engineer can read?
- Which buttons do people press, what do they search for, and what do they add to the basket?
- What errors do users hit that my backend never logs?
You may already have a tool for this
Commercial observability products, such as Datadog, Instana, Dynatrace and New Relic, sell RUM as a feature. You add their snippet to your pages, the data goes to their platform, and you usually get extras like session replay and breakdowns by device and country. If that fits your budget and your data rules, it is a perfectly good answer.
OpenTelemetry is the other route. It is an open standard with SDKs for browsers, mobile and every common backend language. You instrument once and send the data to any backend that understands OTLP: a commercial platform, Grafana Tempo, Jaeger or a self-hosted store. The trade-offs are real:
|
Commercial RUM product |
OpenTelemetry |
|
|
Setup effort |
A snippet and an account |
You run a Collector and a trace store, or point it at a platform you already use |
|
Where the data lives |
The vendor's platform |
Wherever you choose, including on-premises |
|
Extras |
Session replay, device and geography views, support |
What you build: device and country views are covered in the follow-up post; the browser SDK is documented as experimental and mostly unspecified |
|
Fits best when |
You want results fast and have no objection to a vendor |
You already use OpenTelemetry on the backend, want to avoid lock-in, or must keep data in your own network |
This post follows the OpenTelemetry route, because it also shows the mechanics that the products hide. Everything you learn carries over: the same ideas apply when you read a commercial tool's RUM data.
Will it work in my environment?
Probably. The approach has five parts, and none of them belongs to a cloud:
- a small SDK in your web pages (or an SDK in your mobile app),
- an OpenTelemetry Collector that receives data from browsers,
- a place to store traces,
- OpenTelemetry on your backend, in whichever language it is written,
- a tool to draw dashboards.
Whether your servers are on-premises, on GCP, on Azure or in Kubernetes changes where you run the Collector and the trace store, not the method. Two things do change with your setup: the Collector's address has to be reachable from your users' browsers, and if your users are in regulated regions, where the data is stored matters (more on that near the end). One honest limit: we have run the lab below only on a single AWS VM with Docker Compose. We did not test other platforms.
The library you pick depends on what your users run:
|
Your app |
Library |
What it covers |
|
Website or web app (plain JS, React, Vue, Angular) |
OpenTelemetry Web SDK (@opentelemetry/sdk-trace-web), used in the lab |
Page loads, clicks, fetch/XHR calls. Not tied to a framework |
|
Android |
opentelemetry-android, a Gradle agent |
Activity and fragment lifecycle, crashes, ANRs, slow and frozen frames, sessions, offline buffering |
|
iOS |
Swift SDK for iOS apps. See the repo's README for what it instruments |
|
|
Flutter |
Dart SDK in the OpenTelemetry org; there are also community Flutter packages |
The one idea that joins browser and backend
A trace is the story of one request. For a browser and a server to tell the same story, they need to agree on an identifier. The browser SDK adds a small header to every API call it makes. The backend's OpenTelemetry library reads it and starts its own span under the browser's span, with the same trace ID:
| http header, defined by W3C Trace Context |
| traceparent: 00-<trace id: 32 hex>-<span id: 16 hex>-01 |
Each side sends its spans to the Collector separately. The trace store matches them by trace ID, and in your dashboard the browser's wait and the server's work appear as one picture. That header is what makes the rest of this post work. You do not write it by hand: the SDK's Fetch instrumentation adds it when the page and the API share an origin, and for APIs on other domains there is a setting, covered in the FAQ.
The lab: a real shop, four containers, one VM
To make this concrete we built a lab, and every screenshot below comes from it. The app is OWASP Juice Shop, a real, maintained Angular and Express web shop with no OpenTelemetry in it. Next to it, Docker Compose runs an OpenTelemetry Collector, Tempo to store the traces, and Grafana to look at them. It takes about 30 minutes the first time (the build is 5 to 10 of them), and when you are done, one terraform destroy removes it.
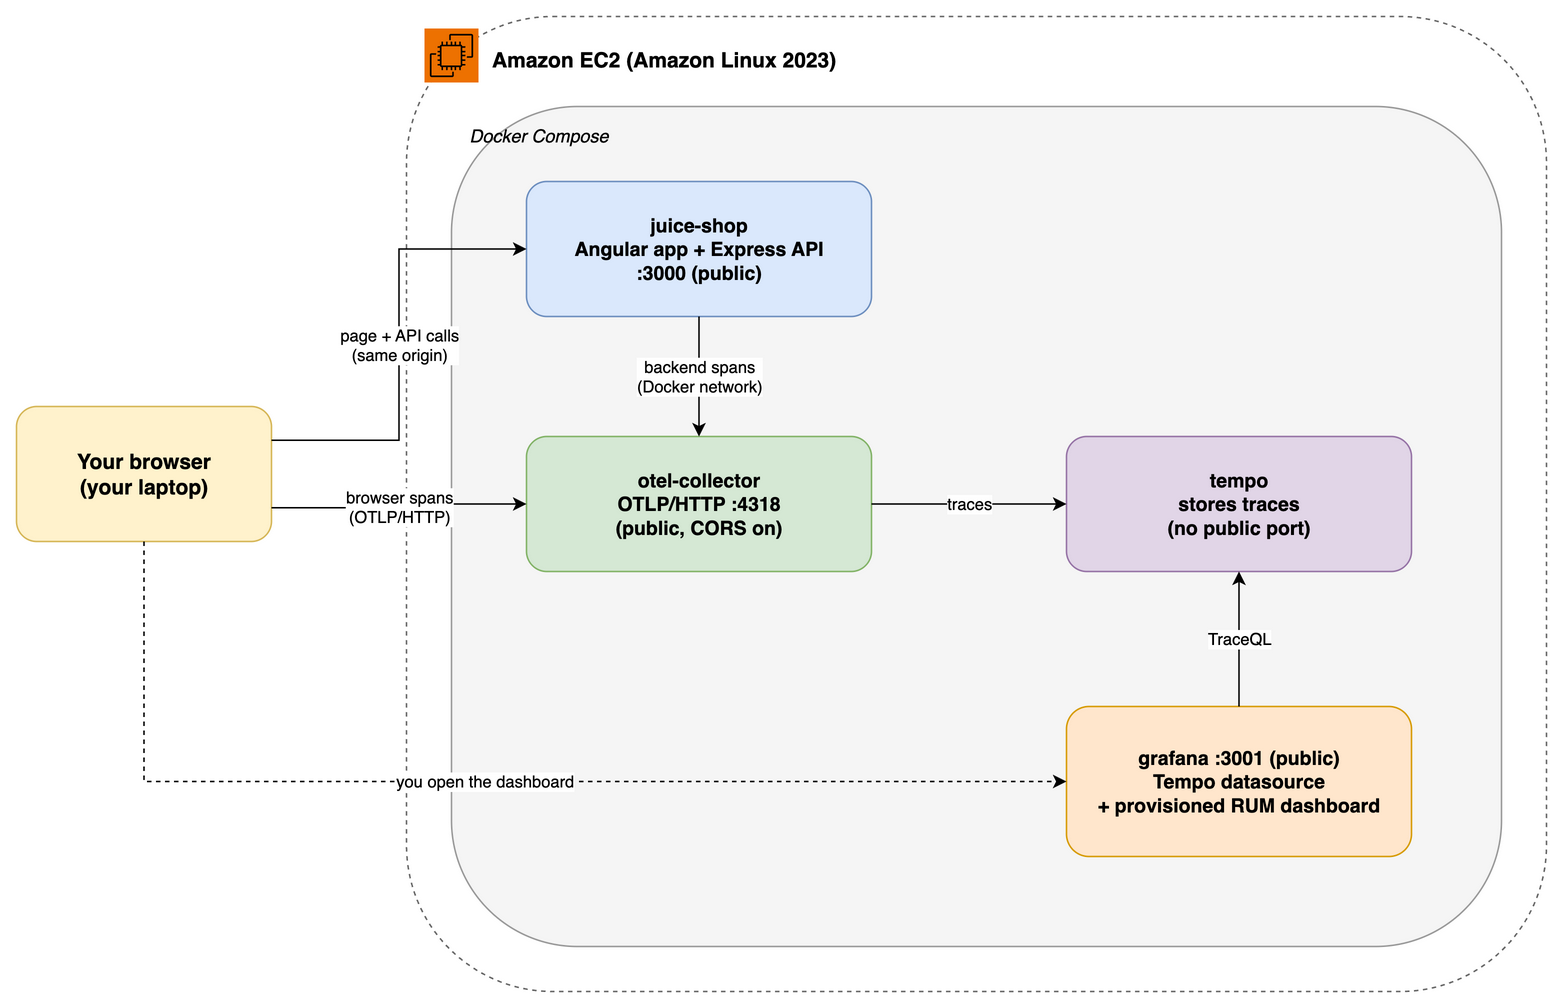
What runs where. Tempo is the only container with no public port.
The browser loads the page and calls the API on the same address. It also sends its own spans straight to the Collector, which is the one call that crosses origins.
Everything is in the repository: the Terraform for the VM (infra/main.tf), the stack (docker-compose.yml) and setup.sh. We do not copy Juice Shop's source into it. setup.sh clones the shop at a pinned version and copies a small overlay/ folder on top, so a git diff inside the clone shows exactly what we changed. The Terraform is a convenience; the script needs a Linux host with Docker Compose and git.
|
Before you start. You need an AWS account and Terraform if you use the supplied VM, or any Linux host with Docker Compose, buildx 0.17 or newer, and git. Run the lab in a throwaway environment, and open its ports only to your own IP address. |
Part 1: your first end-to-end trace
This is not a zero-code setup. Code that measures the browser has to run in the browser, so something ships with your page. For the basics here that is one new file and one import on each side, about 35 lines each. Every change is listed, with the original code next to it, in the repository.
Step 1: let the browser start the trace
Normally a trace begins on the server. Here the browser goes first. The SDK records when the page loads, when someone clicks, and every API call the page makes, with three instrumentations that each switch on with a single line:
- Document load records how long the page took to load.
- User interaction records a span for each click.
- Fetch records a span for every API call and adds the traceparent header to it.
|
Not a developer? The grey boxes below are the real code. You can skip them: the sentence before each one says what it does, and every change has its own page in the repository showing the original code next to the changed code. |
|
In plain words. This is the whole "measure the visitor" part. It creates a small recorder inside the page, tells it to watch three things (the page loading, clicks, and the requests the page makes), and tells it where to send what it saw: the Collector. Nothing here changes how the shop looks or behaves. |
| ts: tracer.ts (abridged) |
| const collectorUrl = `${window.location.protocol}//${window.location.hostname}:4318/v1/traces` const provider = new WebTracerProvider({ resource: resourceFromAttributes({ [ATTR_SERVICE_NAME]: 'juice-shop-frontend' }), spanProcessors: [new BatchSpanProcessor(new OTLPTraceExporter({ url: collectorUrl }))] }) provider.register({ contextManager: new ZoneContextManager() }) registerInstrumentations({ tracerProvider: provider, instrumentations: [ new DocumentLoadInstrumentation(), new UserInteractionInstrumentation(), new FetchInstrumentation({ ignoreUrls: [/\/assets\/i18n\//] }) ] }) |
That is tracer.ts. The only other frontend change is one line at the very top of main.ts, import './tracer', so the page-load instrumentation is in place before the load event fires. Angular patches async code with zone.js, which is why we use the zone-aware context manager; React, Vue and plain JavaScript use a simpler one.
Two things in there will bite you if you copy a tutorial without reading it.
- The exporter URL. Do not write localhost:4318. It works on your laptop and then breaks for everyone else, because "localhost" is now their machine. Build the address from window.location.hostname instead.
- CORS. The Collector lives on a different port than the page, and browsers treat that as a different origin. They send a preflight request first, and if the Collector does not answer it, your spans never arrive: a red error in the console and an empty trace store. The fix is two lines in otel-collector-config.yaml. The lab allows any origin; use your real one.
Step 2: let the backend join in
Browser spans alone are half a story. They say an API call took about 120 ms, not why. In the lab the page and the API share an address, so the Fetch instrumentation already puts traceparent on every call. The backend only has to read it, which OpenTelemetry's Node auto-instrumentation does, as long as it starts before the rest of the app:
|
In plain words. The same idea on the server. It starts a recorder that watches every request the server handles and sends what it saw to the Collector. The enabled: false lines switch off recorders that produced noise and nothing useful. |
| ts: tracing.ts (abridged) |
| const sdk = new NodeSDK({ resource: resourceFromAttributes({ [ATTR_SERVICE_NAME]: 'juice-shop-backend' }), traceExporter: new OTLPTraceExporter({ url: 'http://otel-collector:4318/v1/traces' }), instrumentations: [getNodeAutoInstrumentations({ '@opentelemetry/instrumentation-fs': { enabled: false }, '@opentelemetry/instrumentation-net': { enabled: false }, '@opentelemetry/instrumentation-dns': { enabled: false }, '@opentelemetry/instrumentation-express': { ignoreLayersType: [ExpressLayerType.MIDDLEWARE] } })] }) sdk.start() |
That is tracing.ts, loaded by one import at the top of app.ts. The Collector address is a Docker Compose service name, so nothing is public and there is no CORS to think about. Your backend may be Java, Python or Go instead; every language has an equivalent library, and the idea is the same.
Auto-instrumentation is chatty by default. Express wrapped every middleware in its own span, about 20 per request, and the network instrumentation turned the app's own startup checks into little traces of their own. We turned both off, and one request went from about 24 spans to 4.
Each change in the lab is small, and each has a page in the repository with the original code beside the changed code:
|
File |
In plain words |
Before and after |
|
tracer.ts (new) |
Watches page loads, clicks and requests in the visitor's browser and reports them |
|
|
main.ts (one line) |
Starts that watcher before the page finishes loading |
|
|
tracing.ts (new) |
Does the same on the server |
|
|
app.ts (one line) |
Starts the server-side watcher first |
|
|
Collector config |
Lets the browser send its records in |
|
|
Two package.json files |
Add the OpenTelemetry libraries and fix a broken build step |
See it: one request, two views
Open the shop, click around, then in Grafana go to Explore, pick Tempo and search for the service juice-shop-frontend. Open any GET trace and look at the header: Services 2. The browser's fetch span sits on top, and the backend's spans are nested underneath. Here is one such request:
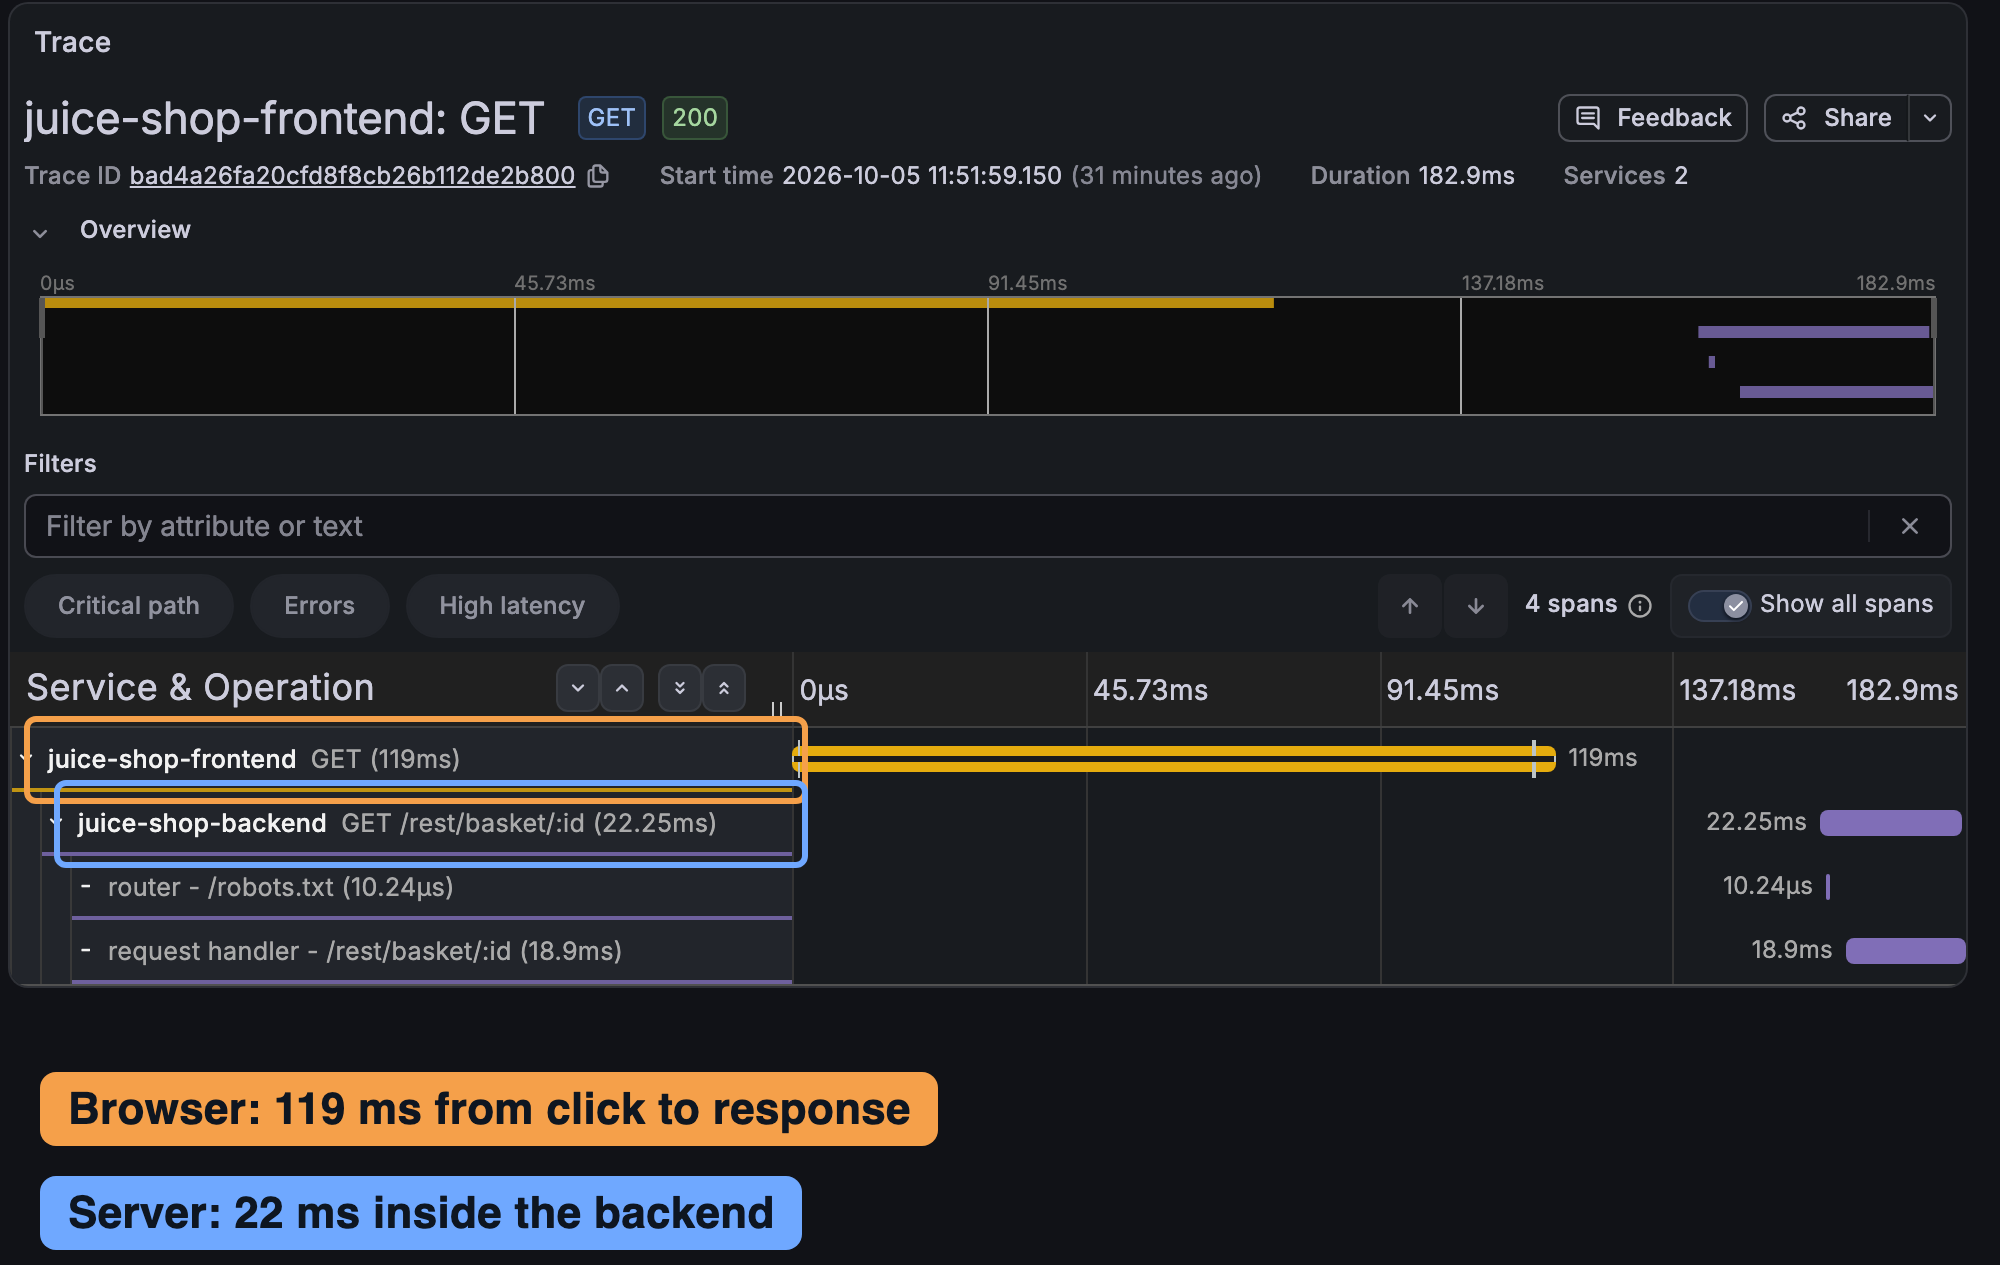
One request, opened in Tempo. The browser's span is 119 ms; the backend's span inside it is 22 ms.
Across 40 requests to this route the medians were 121 ms in the browser and 28 ms on the server, computed from the spans themselves. The server was not slow. The rest of the wait happened where a backend trace cannot look.
Two details are worth knowing.
- Clicks are separate traces by default. A click does not become the parent of the API calls it triggers: Angular calls fetch outside the context the click was made active in. What joins by itself is fetch to backend. The follow-up post shows a small wrapper that joins the click as well, and what it costs.
- The server span can sit slightly to the right of the browser span. That is most likely clock skew between the two machines, because Grafana places spans by timestamp. Durations are still right, and the trace ID, not the time, links them. We did not measure the offset.
Part 2: from single traces to a dashboard
A trace answers "what happened to this request?". It does not answer "are users having a bad time right now?". For that you need a graph.
The usual route is to turn spans into metrics and send them to Prometheus. We skipped it. Tempo can compute metrics from the traces it already stores, with TraceQL metrics queries like { ... } | rate() or quantile_over_time(duration, .95). We sent one of these queries to Tempo with a stock configuration and a series came back, with no metrics-generator involved.
- Write a query and check it returns data. Every query went through Tempo before it went into a panel.
- Turn the queries into panels. Five timeseries panels in one JSON file: rum.json.
- Let Grafana load it from disk. dashboard-provider.yaml and datasources.yaml are mounted by Compose, so the dashboard is simply there on startup, in a folder called RUM, and lives in git.
- To build your own, make a panel in the Grafana UI, export the dashboard as JSON, and drop the file in that folder.

The first dashboard: page load p95 and click rate on top; browser fetch rate and backend routes below it.
Each panel's query is written up, before and after, in the technical dashboard change file.
Before you put this in front of real users
The lab is a throwaway. Three things change when real people are on the other end:
- Privacy. Spans can carry search terms, button labels and page addresses typed by users, and a backend's HTTP spans record visitor IP addresses. Decide what you record, scrub it in the Collector before storage, and tell your privacy team. The follow-up post shows how, and what we found in the lab.
- The Collector is public by design. Anyone can send it spans. Restrict the allowed origins, rate-limit in front of it, and remember that a browser cannot keep a secret.
- Sampling changes what the numbers mean. The lab ran at 100% of traffic. Sampled data keeps ratios roughly right but shrinks counts, and the details are in the follow-up post.
What to do on Monday
- Run the lab, or point the Part 1 steps at one page of your own app for a day.
- Open a trace and look for two services. That is browser and backend in one story.
- Compare the browser's wait with the server's time on your busiest route. That gap is the number you take to the next meeting.
Next in this series: Real User Monitoring with OpenTelemetry-2 (From a Trace to the Questions Your Business Asks). It turns the same data into login success, a one-number Apdex for how fast the app felt, what people search for and add to the basket, and device and country breakdowns, plus a way to join a click to the requests it causes.
Lab troubleshooting: what bit us
None of these is OpenTelemetry's fault, but each one stopped us for a while:
- Docker on Amazon Linux 2023 is too old to build. The packaged Docker ships buildx 0.12, and docker compose build needs 0.17 or newer. user_data.sh installs a current one.
- Juice Shop's own frontend build broke. Its build script runs npm run sbom, which looks for a stats.json file that the new Angular builder never writes. The overlay's package.json drops that step.
- A fresh VM is not ready when SSH answers. user_data is still installing Compose and buildx, and setup.sh fails with exit 125. Run sudo cloud-init status --wait on the instance, then run it again.
- Units. TraceQL metrics return seconds. We labelled them milliseconds and the page-load panel reported a 2 ms page load. That is how we noticed.
Try it, and tell us what you find
If you want to see the gap in your own world, run the lab, then point the same ideas at one page of your own app for a day. The whole setup is in one repository: Terraform for the VM, the Compose stack, the overlay with the instrumentation, both dashboards, and one before-and-after file per change. A star on the repo helps others find it.
We would like to hear what you find. How far apart are the browser and server medians on your busiest route, and which page is the worst offender? If you would rather not set this up alone, Kloia's observability team builds this kind of browser-to-backend tracing alongside your own people; get in touch.
References
- Companion repository: https://github.com/kloia/observability-opentelemetry-rum-demo
- Kloia: Zero-Code Observability on Linux VMs with the OpenTelemetry Injector
- OpenTelemetry Web SDK: opentelemetry.io/docs/languages/js/getting-started/browser
- Node auto-instrumentation: github.com/open-telemetry/opentelemetry-js-contrib
- W3C Trace Context: w3.org/TR/trace-context
- Tempo TraceQL metrics: grafana.com/docs/tempo/latest/traceql/metrics-queries
- OWASP Juice Shop: github.com/juice-shop/juice-shop

Zero-Code Observability on Linux VMs with the OpenTelemetry Injector
Run AWS Locally with LocalStack for Faster Development

No Comments Yet
Let us know what you think