
.svg "kloia.png")
By Serhat Düzen on Oct 2, 2026, 8:34:47 AM
Distributed tracing only pays off when every service in a request path is instrumented - an SDK, a middleware and a redeploy, once per service, once per language. The one service nobody got to is exactly where the trace breaks. eBPF moves that work into the Linux kernel. In this post we use OpenTelemetry eBPF Instrumentation (OBI) to get two things that normally need code changes - trace context propagated across services, and trace_id/span_id stamped onto the logs those services already write - and test it on a real EKS cluster running four services in four languages.
What is eBPF
eBPF lets you run small, sandboxed programs inside the kernel, triggered by events, without a kernel module and without a reboot. A program is compiled to bytecode, loaded with the bpf() syscall, checked by the kernel verifier, JIT-compiled to native code and attached to a hook. Results go to a userspace agent through maps and ring buffers.
The verifier is what makes this safe in production: it walks every execution path and refuses to load anything that could read memory it does not own, dereference an unchecked pointer or loop without a bound. A buggy kernel module can panic a node; a buggy eBPF program simply does not load. CO-RE and BTF (/sys/kernel/btf/vmlinux) let one binary run across kernel versions.
| Hook | Fires on | Used for |
| kprobe / uprobe | Kernel or user-space function entry/exit | Socket reads/writes, HTTP/gRPC and TLS libraries |
| Tracepoint | Stable kernel events | Syscalls, process lifecycle |
| TC (traffic control) | Packets leaving/entering an interfacePackets leaving/entering an interface | OBI writes traceparent into outgoing requests here |
For observability this means one agent per node sees every process, in any language, with nothing added to the application. The tradeoff: you see what crosses process and network boundaries, not business logic inside a function.
Context Propagation
A span on its own is a timing; a trace exists only when the downstream service knows which upstream request it belongs to - the job of the W3C traceparent header. OBI reads incoming traceparent automatically. Writing it on outgoing calls is off by default and happens in two ways:
- Network level, any language: a TC eBPF program adds traceparent to outgoing HTTP/1.x requests (and an HPACK header for gRPC). Needs kernel 5.17+. Over HTTPS the header cannot be written, so context travels at TCP level - readable only by another OBI service, and dropped by any L7 proxy in between.
- Library level, Go only: the header is written into process memory, which also works over TLS.
Inside a process, OBI links an outgoing call to the incoming request that caused it by thread (Java thread pools, Node.js async hooks, Go goroutines, Python with uvloop). Keep that in mind - it is where things broke for us.
Log-Trace Correlation Without Touching the Logger
While a span is active on a thread, OBI intercepts that process's write syscalls to stdout/stderr and injects the trace context into the line. OBI does not ship logs; the enriched line goes to the same stream and your existing pipeline carries it.
| json |
|
// what the application wrote
{"level":"info","msg":"work done"}
// what reaches the container log
{"level":"info","msg":"work done","trace_id":"6fc4c7af...","span_id":"cef2c4c5..."}
|
- Needs kernel 6.0+, the BPF filesystem at /sys/fs/bpf, and no kernel lockdown.
- Only lines written on the request thread while a span is active are enriched. Set PYTHONUNBUFFERED=1 for Python; ASP.NET Core's default console logger is not supported.
- OBI replaces the original line with NUL bytes in the container log file - filter those in your collector.
- With OBI's Config v2 this works only for standalone OBI, so on Kubernetes use the Config v1 format.
The Lab
Everything below runs from the companion repository, kloia/observability-ebpf-demo. It builds a single-node EKS 1.36 cluster with four services - Python, Node.js, Java and .NET - that call each other in a chain. None of them contains tracing code. OBI sends traces to an OpenTelemetry Collector, which forwards them to Tempo and ships container logs to OpenSearch. Grafana reads both, and a small Prometheus holds the service-graph metrics.
The infrastructure is three Terraform stages, applied in order. Each stage checks that the previous one finished before it changes anything:
| Stage | Creates | Waits for |
| infra/01-cluster | VPC, EKS 1.36 with one node, 4 ECR repositories | - |
| infra/02-observability | OpenSearch, Tempo, Prometheus, Collector, Grafana, OBI (Helm) | Cluster and node group ACTIVE |
| infra/03-apps | The four services and a load generator | OBI ready, images in ECR |
Step 1 - Create the cluster
You need AWS credentials, Terraform 1.9+ and Docker with Buildx. Set allowed_cidr to your own IP: the demo UI and Grafana NodePorts are opened only to it.
| bash |
|
git clone https://github.com/kloia/observability-ebpf-demo.git
cd observability-ebpf-demo
cp infra/01-cluster/terraform.tfvars.example infra/01-cluster/terraform.tfvars
# edit allowed_cidr: your IP/32 (curl -s https://checkip.amazonaws.com)
terraform -chdir=infra/01-cluster init
terraform -chdir=infra/01-cluster apply
|
Step 2 - Build and push the images
| bash |
|
REGION=$(terraform -chdir=infra/01-cluster output -raw region)
REGISTRY=$(terraform -chdir=infra/01-cluster output -raw ecr_registry)
aws ecr get-login-password --region "$REGION" \
| docker login --username AWS --password-stdin "$REGISTRY"
for app in python-app node-app java-app dotnet-app; do
docker buildx build --platform linux/amd64 --push \
-t "$REGISTRY/ebpf-demo/$app:1.0.0" "apps/$app"
done
|
The services are in apps/. Each one writes JSON logs to stdout and returns the traceparent header it received, so you can see propagation from outside.
Step 3 - Install the observability stack
| bash |
|
terraform -chdir=infra/02-observability init
terraform -chdir=infra/02-observability apply
|
All six components are Helm releases in main.tf. Most of the values are defaults. Three files hold the settings that make propagation and correlation work:
OBI - values/obi.yaml
| yaml |
|
contextPropagation:
enabled: true # pod permissions only, not propagation
config:
data:
ebpf:
context_propagation: all # this writes traceparent
log_enricher:
services:
- service:
- k8s_namespace: demo
open_ports: "5001-5004"
|
The chart's contextPropagation.enabled only gives the pod host network and NET_ADMIN. Without ebpf.context_propagation: all, every service shows up as its own single-span trace. Use the same selector for discovery.instrument and log_enricher so every traced process also gets its logs enriched.
Collector - values/otel-collector.yaml
| yaml |
|
operators:
- type: container
- type: filter # drop OBI's NUL placeholder lines
expr: 'body matches "^[\\x00\\s]*$"'
- type: json_parser
parse_from: body
trace:
trace_id: { parse_from: attributes.trace_id }
span_id: { parse_from: attributes.span_id }
|
The trace block turns the fields OBI injected into the log record's own trace context. The OpenSearch exporter then writes a traceId field, which is what Grafana links on. The file also sets service.enabled: true: in daemonset mode the chart creates no Service otherwise, and OBI has nowhere to send traces.
Grafana - values/grafana.yaml
| yaml - abridged |
|
- name: Tempo
jsonData:
tracesToLogsV2:
datasourceUid: opensearch
customQuery: true
query: 'traceId:"$${__trace.traceId}"'
serviceMap:
datasourceUid: prometheus
- name: OpenSearch
jsonData:
dataLinks:
- field: traceId
title: Open trace in Tempo
datasourceUid: tempo
url: '$${__value.raw}'
|
tracesToLogsV2 goes from a span to its logs, and dataLinks goes from a log line back to its trace. The service graph is not drawn from traces directly: Tempo's metrics-generator computes it from spans and pushes it to Prometheus with remote_write (values/tempo.yaml, values/prometheus.yaml).
Step 4 - Deploy the services
| bash |
| terraform -chdir=infra/03-apps init terraform -chdir=infra/03-apps apply terraform -chdir=infra/02-observability output -raw grafana_admin_password; echo |
main.tf deploys the four services and a load generator that calls the chain every two seconds. The outputs are demo_ui_url (port 30080) and grafana_url (port 30300); log in to Grafana as admin with the password above.
Step 5 - See it
Open the demo UI and click “Call the chain”. Every hop shows the same trace ID, and nobody set it:
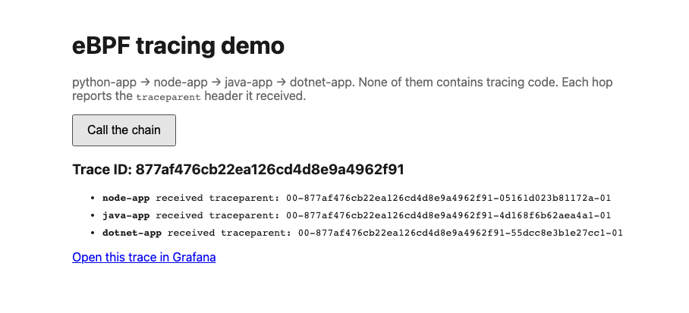
Each hop reports the traceparent it received: one trace ID across four languages
In Grafana, go to Explore → Tempo and run { resource.service.name = "python-app" }. Open a trace to see all four services:
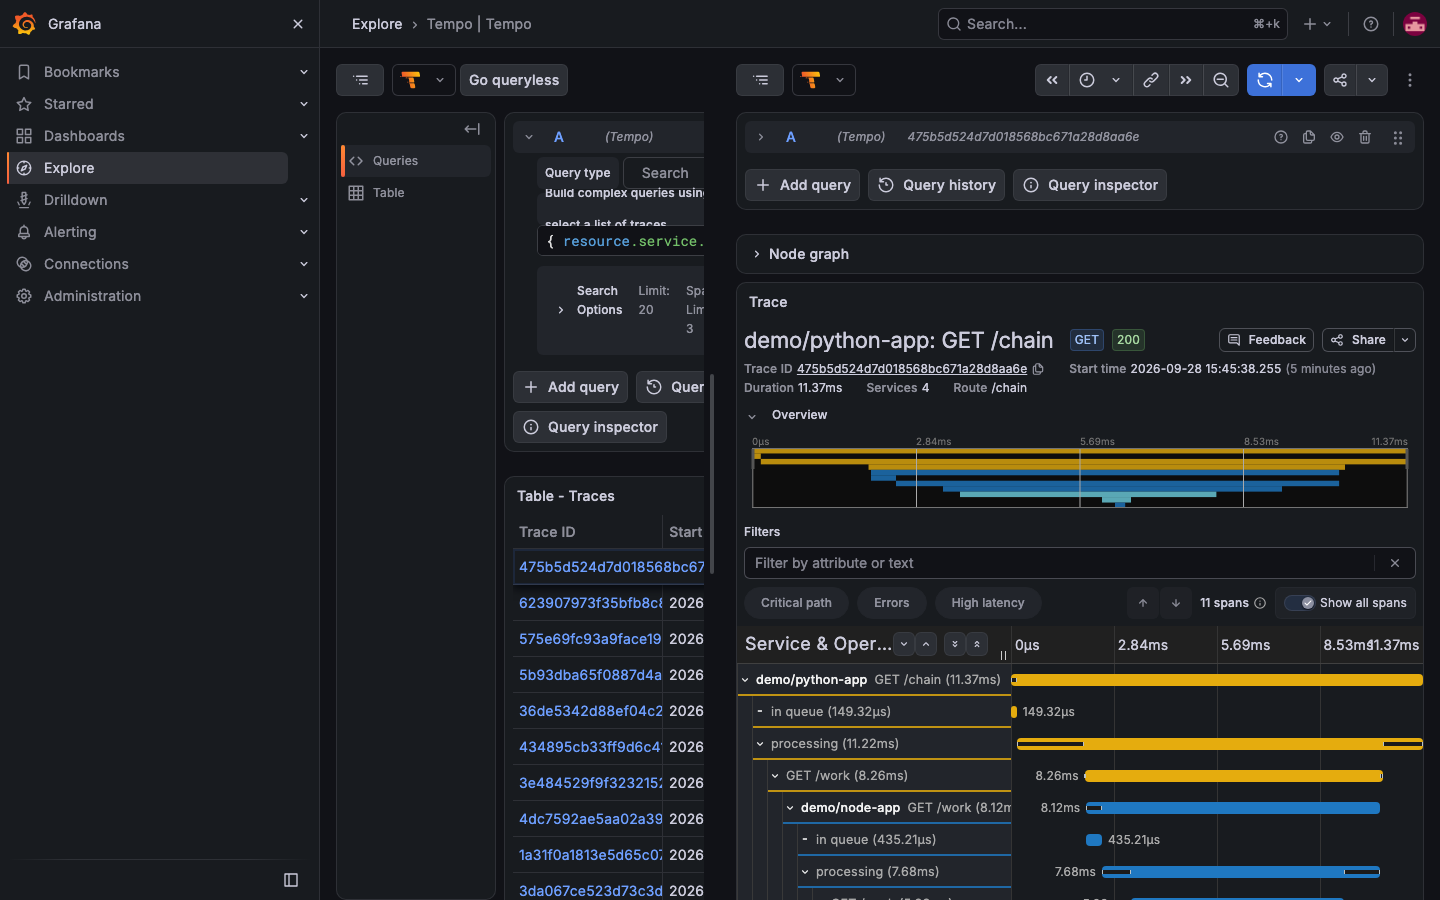
One trace, four services, eleven spans
Expand a span and click “Logs for this span”: Grafana runs traceId:"<trace>" against OpenSearch and returns the lines from all four pods. From Explore → OpenSearch, the traceId link on any log line opens its trace. The “Service Graph” tab under Tempo shows the call map:
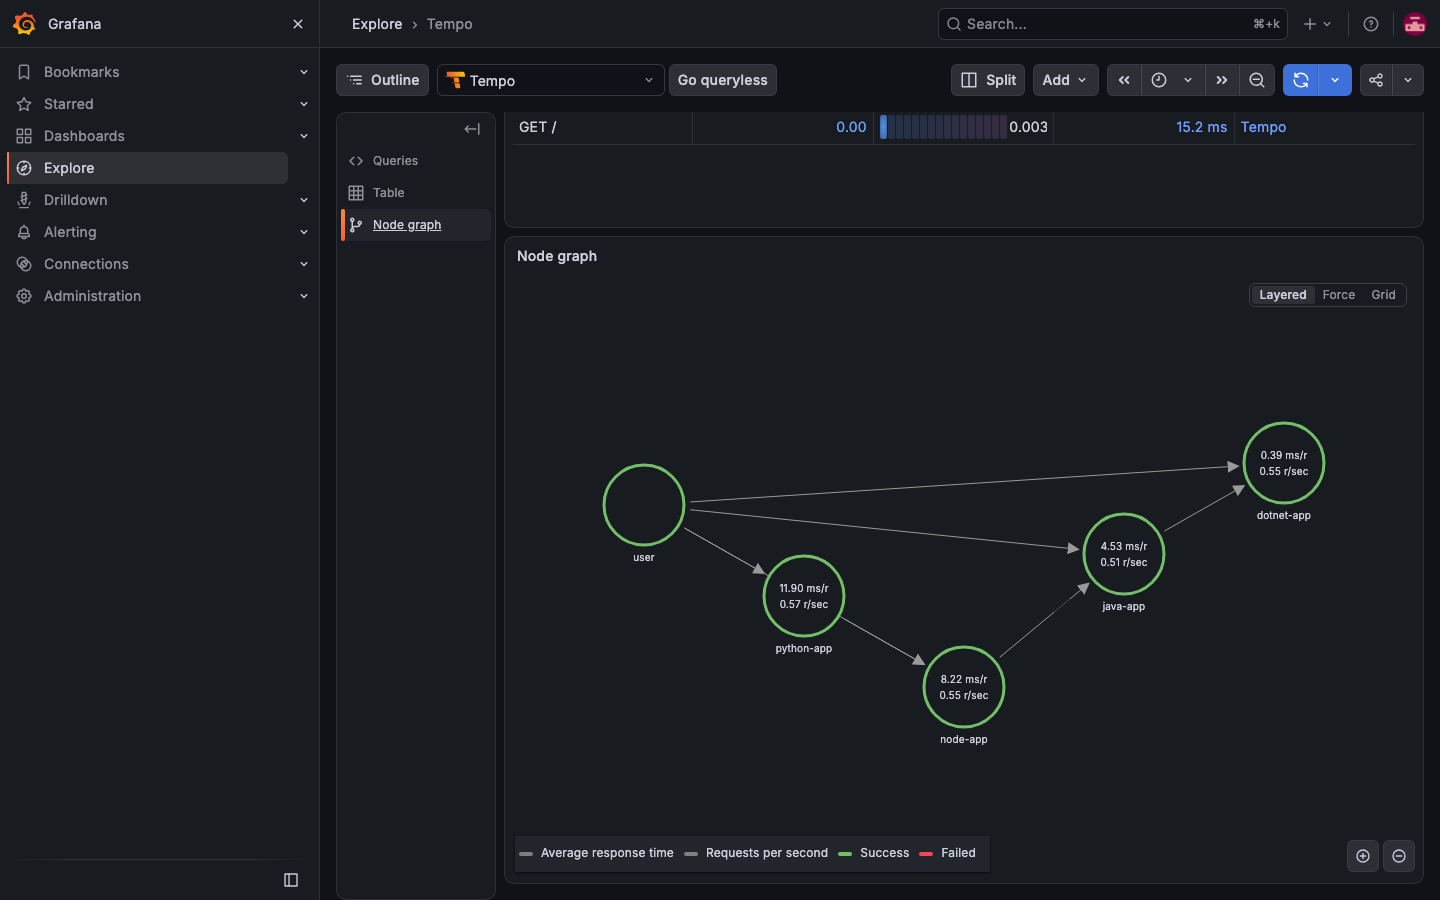
Service graph built from OBI's spans: user → python-app → node-app → java-app → dotnet-app
Clean up
| bash |
|
terraform -chdir=infra/03-apps destroy
terraform -chdir=infra/02-observability destroy
terraform -chdir=infra/01-cluster destroy
|
Nothing uses persistent volumes, so the only EBS volume is the node's root disk, and it is deleted with the node. While it runs, the lab costs roughly USD 0.30 per hour.
What Broke When We Ran It for Real
- Java's default HTTP client broke propagation. With no client library on the classpath, Spring's RestClient uses the JDK HttpClient, which does its I/O on internal worker threads. The call to the next service got a brand-new trace ID about 4 times in 5, even with sequential requests. Adding Apache HttpClient5 (blocking I/O on the calling thread) fixed it: 5 of 5 (pom.xml).
- ASP.NET Core lost log enrichment on about half its lines, even with a synchronous, auto-flushing writer and no concurrency. Kestrel can finish a request on a different thread-pool thread than the one OBI attached context to. We did not find an in-app fix; treat it as a limitation (Program.cs).
- One field name dropped a quarter of the logs. Three services logged time as an ISO string, Python as a float. OpenSearch mapped the field as date from the first document and rejected the rest with mapper_parsing_exception - visible only in the Collector's own logs. Use the same log field formats in every service that shares an index (app.py).
- An AWS Local Zone broke cluster creation. aws_availability_zones returned eu-central-1-ist-1a, where EKS control planes cannot run. Filter on zone-type = availability-zone (main.tf).
The lesson from the first two: OBI's "log on the request thread" rule is broader than stdout buffering. Any runtime or HTTP client that moves work to another thread can break it - test with the client library each service really uses.
Limitations Worth Knowing
- HTTPS and service meshes: header injection is impossible on encrypted traffic; TCP-level context survives only OBI-to-OBI and no L7 proxy.
- Kernel spread: 5.8 baseline, 5.17 propagation, 6.0 log correlation. Check every node group.
- Privileges: OBI is a privileged, host-network DaemonSet. An unprivileged capability set exists; use it where policy requires.
- Pre-1.0: OBI is moving fast and config is migrating to v2. Pin chart versions.
Conclusion
eBPF does not change what tracing needs - a traceparent on every hop and a trace ID on every log line. It changes who does the work: one DaemonSet instead of an SDK per team and per language, emitting standard OTLP into whatever backend you already run. On a real four-language cluster it delivered a single trace and a live service graph with zero application changes. It also showed where the thread-based assumptions end, so test propagation and log enrichment against your own runtimes before you promise end-to-end traces.
For the same zero-code idea outside Kubernetes — plain Linux VMs, via the OpenTelemetry System Packages injector rather than eBPF — see our companion post: "Zero-Code Observability on Linux VMs with the OpenTelemetry Injector."
References
- Companion repository - https://github.com/kloia/observability-ebpf-demo
- OBI documentation - opentelemetry.io/docs/zero-code/obi
- OBI trace-log correlation - opentelemetry.io/docs/zero-code/obi/trace-log-correlation
- Tempo metrics-generator - grafana.com/docs/tempo/latest/metrics-generator
- What is eBPF? - ebpf.io/what-is-ebpf
No Comments Yet
Let us know what you think