
.svg "kloia.png")
By Mertcan Akdeniz on Jul 31, 2026, 8:11:08 AM

How the new OpenTelemetry System Packages bring Kubernetes-style zero-code tracing to Linux VMs without manual agent setup.
Have you ever noticed how effortless auto-instrumentation feels on Kubernetes, and how much of a chore it becomes the moment you step onto a plain Linux VM? On Kubernetes you install the OpenTelemetry Operator, add an annotation, and your pods start emitting traces with no code changes. On a VM or a bare-metal host, the same outcome has traditionally meant editing every service, wiring a language agent into each startup command, and juggling environment variables by hand.
That has always felt like a gap in observability maturity to me. It is the kind of grey area where teams end up SSH-ing into boxes and bolting agents manually. The OpenTelemetry community is now beginning to close that gap. The first pre-release of the OpenTelemetry System Packages (v0.0.2) turns the whole thing into a single command: apt install opentelemetry.
In this post I install it on a RHEL EC2 instance, instrument four applications written in four different languages without touching a line of their code, and share the field notes, including the things that broke, along the way. Let’s dive in!
The gap: observability on VMs
Think of the injector the way a platform team thinks about a golden path: a capability you provide to delivery teams so they don’t have to change their code to get value. On Kubernetes that golden path already existed. On VMs it didn’t: every team rolled its own agent wiring, and consistency suffered. If your workloads run on lift-and-shift estates, on-prem hosts, or classic EC2 fleets, this is exactly the friction the System Packages remove.
What Are the OpenTelemetry System Packages?
The Packaging SIG bundles three building blocks into modular system packages you install through your normal package manager:
-
OpenTelemetry Injector: a shared library that injects the language auto-instrumentation agent into every process on the host.
-
OpenTelemetry eBPF Instrumentation (OBI): kernel-level, language-agnostic telemetry.
-
OpenTelemetry Collector: receives the telemetry locally and forwards it onward.
You get all of it with one line:
apt install opentelemetry     # Debian / Ubuntu
dnf install opentelemetry     # Fedora / RHEL
By default every instrumented app exports OTLP to localhost:4317 (gRPC) and localhost:4318 (HTTP), with no code or configuration required for a local setup.
How the Injector Works
The trick is a single line the installer adds to /etc/ld.so.preload. The dynamic linker loads that shared library into every new process on the host, and the library injects the right agent per runtime: -javaagent for the JVM, NODE_OPTIONS for Node, a CoreCLR profiler for .NET, and so on.
There is no daemon to babysit: instrumentation is implemented through a linker-level hook rather than a continuously running service. I find that a surprisingly elegant answer to a problem we’ve been solving by hand for years.
However, this host-wide behavior also means that the injector can affect build tools and other processes using supported runtimes. I cover one concrete example later in the field notes.
The Demo Setup
To make the cross-language story tangible, I built a four-service chain. Each service simply calls the next one over HTTP, and none of them contains any OpenTelemetry code. That is the whole point:
The full demo is on GitHub: kloia/observability-otel-injector-demo. Clone it and follow along.
curl :5001/chain -> python(5001) -> node(5002) -> java(5003) -> dotnet(5004)
Hitting the Python entrypoint produces a single distributed trace spanning all four runtimes. Jaeger runs alongside as the backend:
docker run -d --name jaeger \
-e COLLECTOR_OTLP_ENABLED=true \
-p 16686:16686 -p 4317:4317 -p 4318:4318 \
jaegertracing/all-in-one:1.60
Prerequisites
For this walkthrough you need:
-
A Linux VM (I used a RHEL 8 EC2 instance).
-
One or more applications to instrument (mine are Python, Node.js, Java and .NET).
-
A trace backend. I run Jaeger all-in-one in Docker; it exposes OTLP on 4317/4318 and a UI on 16686.
Installing the OpenTelemetry Packages
Add the Repository (RHEL / YUM)
cat <<EOF | sudo tee /etc/yum.repos.d/opentelemetry.repo
[opentelemetry]
name=OpenTelemetry Auto-Instrumentation System Packages
baseurl=https://open-telemetry.github.io/opentelemetry-packaging/rpm/packages
enabled=1
gpgcheck=0
EOF
The suite ships its own Collector, which also binds localhost:4317. Since I send traces straight to Jaeger on that port, I disable the bundled Collector first (a harmless no-op if it isn’t present):
sudo systemctl disable --now opentelemetry-collector 2>/dev/null || true
Install the Full Suite
sudo dnf install -y opentelemetry
The scriptlet output tells the story: the injector registers itself with the dynamic linker, and the four language packages install alongside it:
Installing : opentelemetry-injector-0.0.2-1.x86_64 1/6
Running scriptlet: opentelemetry-injector-0.0.2-1.x86_64 1/6
Adding /usr/lib/opentelemetry/injector/libotelinject.so to /etc/ld.so.preload
OpenTelemetry Injector installed successfully.
All new processes will now be instrumented automatically.
Installing : opentelemetry-dotnet-autoinstrumentation-0.0.2-1.x86_64 2/6
Installing : opentelemetry-java-autoinstrumentation-0.0.2-1.noarch 3/6
Installing : opentelemetry-nodejs-autoinstrumentation-0.0.2-1.noarch 4/6
Installing : opentelemetry-python-autoinstrumentation-0.0.2-1.x86_64 5/6
Installing : opentelemetry-0.0.2-1.noarch 6/6
Complete!
Verify the Injector Is Active
There is no service to check. Just confirm the preload hook and the installed packages:
$ cat /etc/ld.so.preload
/usr/lib/opentelemetry/injector/libotelinject.so
$ ls /etc/opentelemetry/
dotnet injector java nodejs python
$ rpm -qa | grep opentelemetry
opentelemetry-0.0.2-1.noarch
opentelemetry-injector-0.0.2-1.x86_64
opentelemetry-java-autoinstrumentation-0.0.2-1.noarch
opentelemetry-nodejs-autoinstrumentation-0.0.2-1.noarch
opentelemetry-python-autoinstrumentation-0.0.2-1.x86_64
opentelemetry-dotnet-autoinstrumentation-0.0.2-1.x86_64
That single line in /etc/ld.so.preload is the entire mechanism, and the per-language config folders live under /etc/opentelemetry/.
Running the Apps and Capturing Traces
Because the injector hooks new processes, anything I start from here is auto-instrumented. I set OTEL_SERVICE_NAME per app so each shows up with a clean name, then trigger the chain:
curl localhost:5001/chain
The first thing I noticed in Jaeger is that all four services showed up on their own. I never registered them anywhere. That is the injector setting each service name from the process it wraps: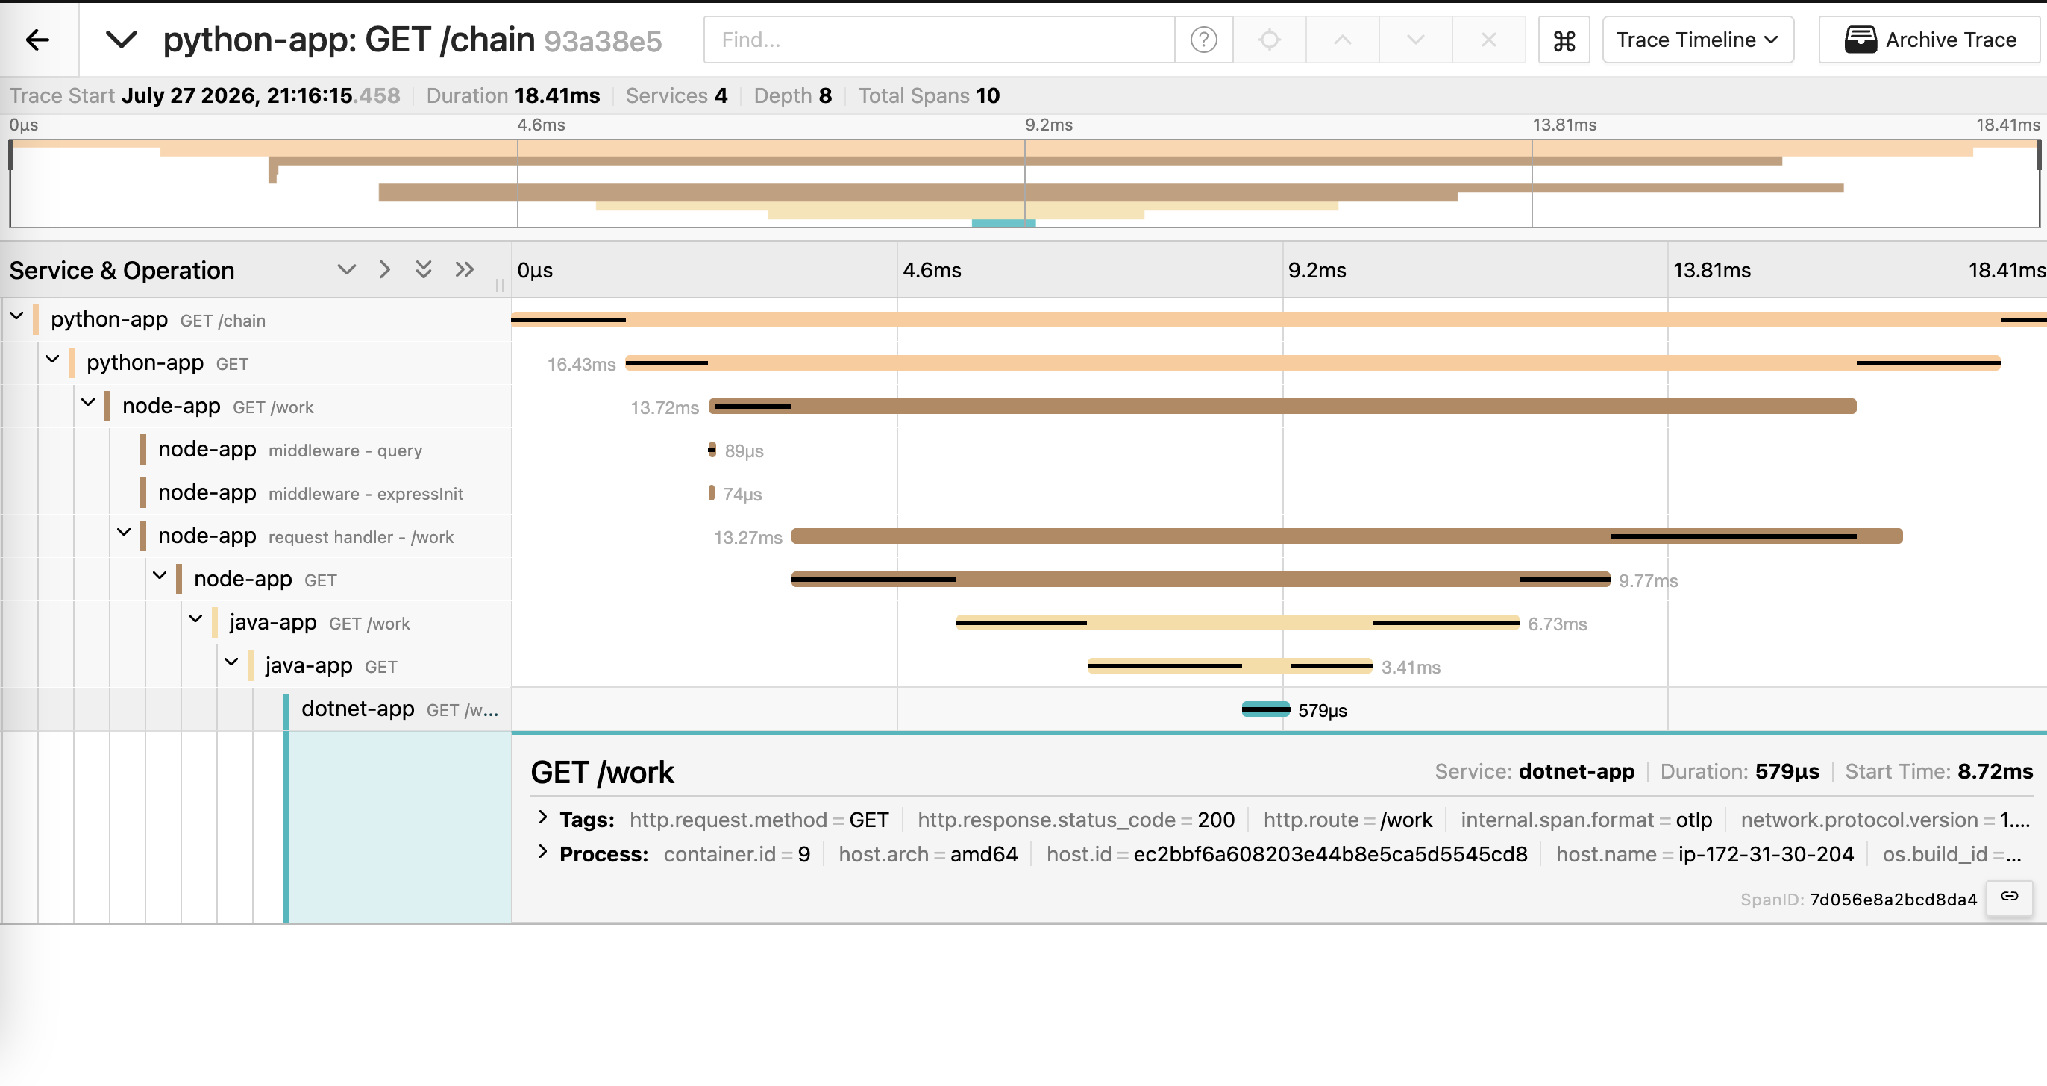
One distributed trace, four languages: python-app → node-app → java-app → dotnet-app. Span tags such as telemetry.sdk.language and internal.span.format=otlp confirm the auto-instrumentation is real.
And the dependency-graph view makes the cross-language flow obvious:
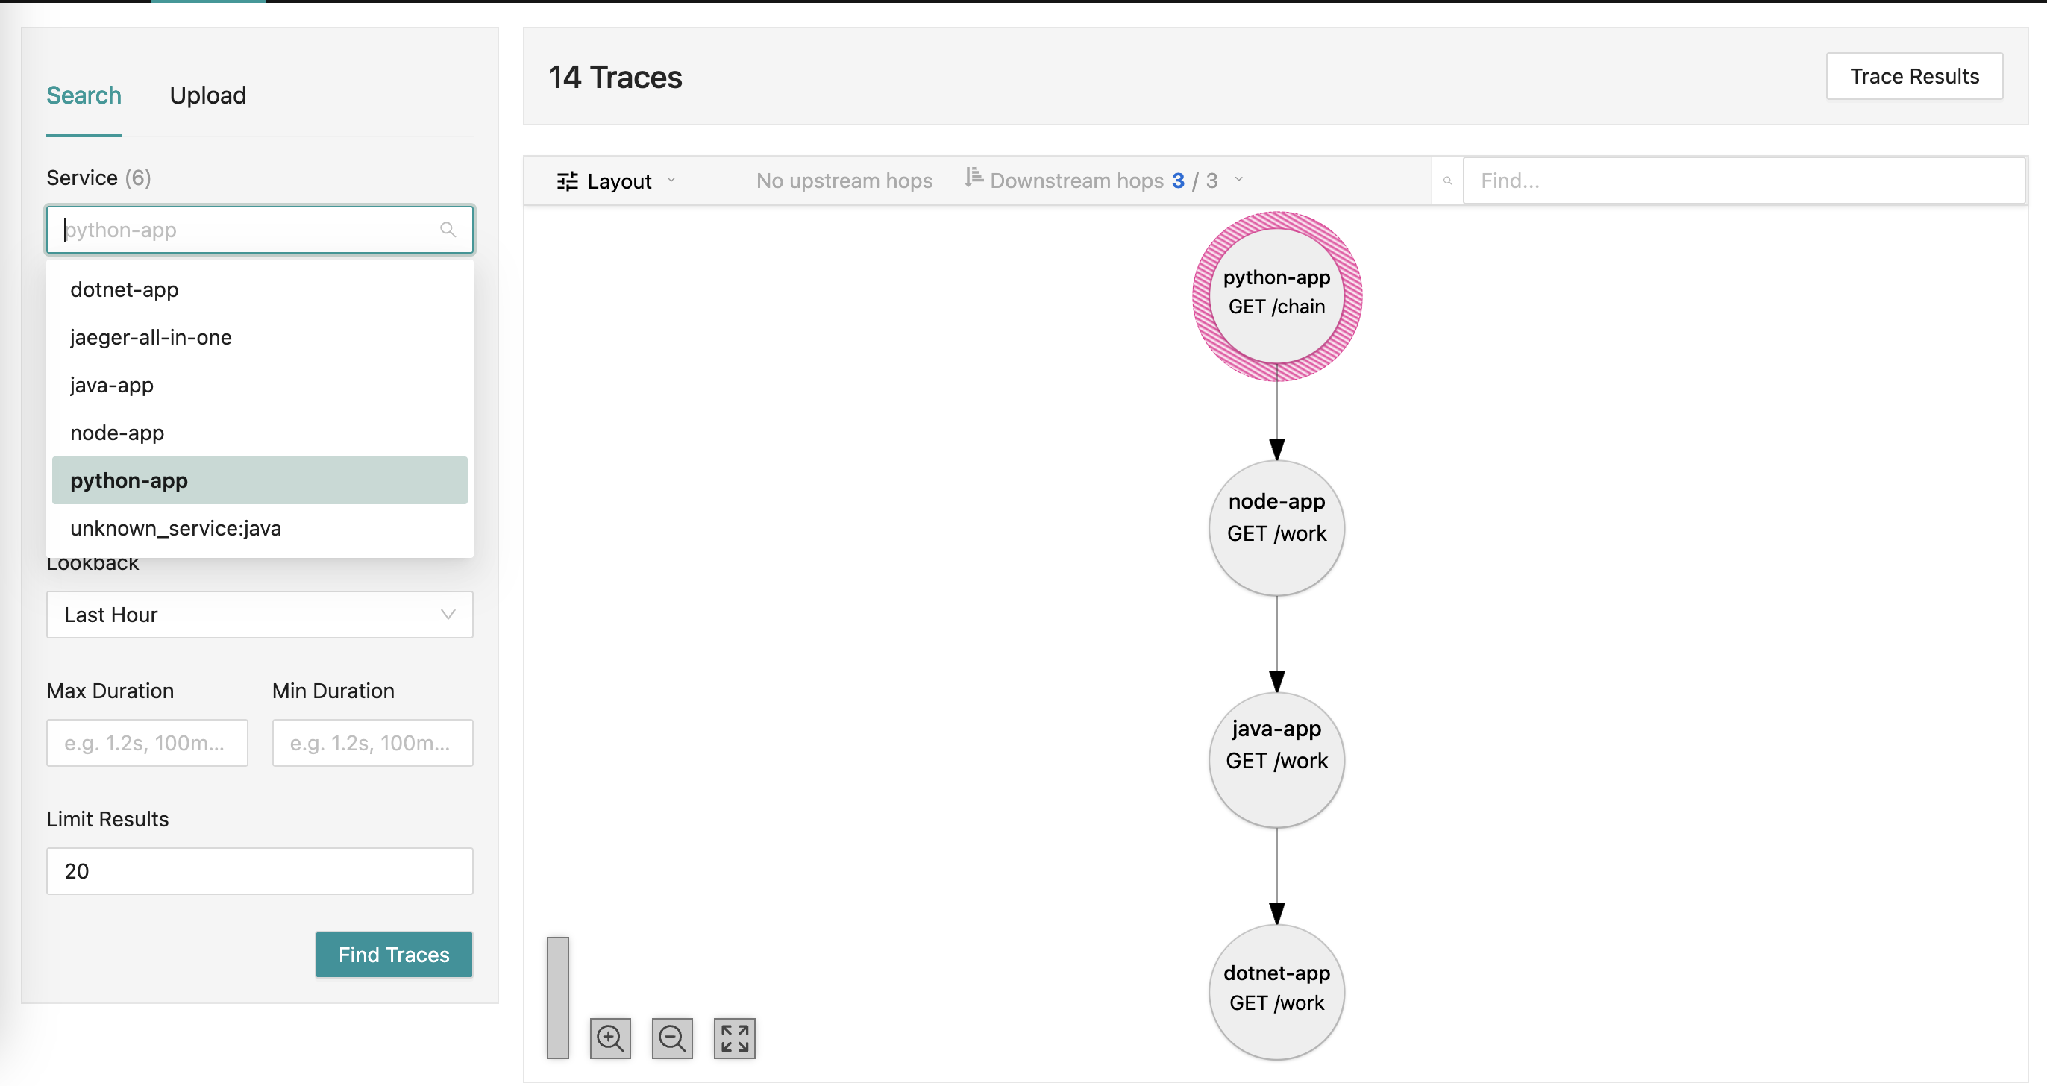
Jaeger’s dependency graph (DAG) view of the same cross-language flow.
Field Notes: Real-World Gotchas (RHEL 8)
The happy path above hides a few lessons worth sharing, and I’d rather you learn them from me than from a broken build. On RHEL 8 almost every default runtime is too old for this pre-release injector.
1. The Runtimes Were Too Old
Out of the box RHEL 8 ships Node 10, Java 8, Maven 3.5 and Python 3.6, all below what the injector (and a modern Spring Boot / .NET app) needs. Am I the only one who forgets how old the defaults on an enterprise distro can be? Symptoms and fixes:
-
Node 10: the injected OTel code uses modern JS syntax the old runtime cannot even parse (SyntaxError: Unexpected token;). Install Node 18.
-
Java 8 / Maven 3.5: Spring Boot 3.x needs JDK 17 and Maven 3.6.3+. Install JDK 17 and Maven 3.9.
-
Python 3.6 (and even 3.9): reported as “unsupported Python version” by the injector. Python 3.11 works.
2. The Injector Instruments Your Build Tools Too
This is the one that made me stop and think. Because the hook is global, dotnet build itself gets instrumented, and the injected System.Diagnostics.DiagnosticSource assembly collides with the SDK’s NuGet restore, breaking the build:
error : Unable to load the service index for source https://api.nuget.org/v3/index.json
error : Could not load ... 'System.Diagnostics.DiagnosticSource, Version=10.0.0.0
The lesson: you want to instrument the running app, not the build. Disable the profiler for the build step only, then run the app normally so the runtime process stays instrumented:
 # build with the profiler explicitly OFF
CORECLR_ENABLE_PROFILING=0 CORECLR_PROFILER= DOTNET_STARTUP_HOOKS= \
OTEL_DOTNET_AUTO_HOME= dotnet publish -c Release -o out

# run normally -> the injector re-applies at runtime -> instrumented
OTEL_SERVICE_NAME=dotnet-app dotnet out/dotnet-app.dll
With the profiler off, the restore succeeds and the build completes cleanly:
  Determining projects to restore...
  Restored /home/ec2-user/.../dotnet-app.csproj (in 762 ms).
  dotnet-app -> .../bin/Release/net8.0/dotnet-app.dll
  dotnet-app -> .../out/
Try It Yourself
Everything above is in the demo repo: four plain apps, a run.sh, and a README that documents these gotchas so you can reproduce them:
github.com/kloia/observability-otel-injector-demo
git clone https://github.com/kloia/observability-otel-injector-demo.git
cd observability-otel-injector-demo
# 1. trace backend
docker run -d --name jaeger -e COLLECTOR_OTLP_ENABLED=true \
-p 16686:16686 -p 4317:4317 -p 4318:4318 jaegertracing/all-in-one:1.60
# 2. install the injector (RHEL shown; see README for Ubuntu)
sudo dnf install -y opentelemetry
# 3. build, run, and generate a trace
./run.sh
curl localhost:5001/chain
Then open Jaeger, pick the python-app service, and watch a single trace flow through all four languages.
Final Thoughts
The OpenTelemetry System Packages bring the zero-code, Kubernetes-style instrumentation experience to plain Linux hosts. In one command you can:
✅ Instrument Java, Node.js, Python and .NET apps with no code changes.
✅ Get connected, cross-language distributed traces out of the box.
✅ Skip the per-service agent wiring that VM-based observability used to require.
One caveat: v0.0.2 is a pre-release hosted on interim GitHub Pages infrastructure, and the repository URLs will change. On older distributions, budget time to modernise your runtimes and to scope the injector to runtime rather than your build. But the direction is clear, and for anyone who has been treating VM observability as a second-class citizen, this is a golden path worth adopting.

Run AWS Locally with LocalStack for Faster Development
Setting Up the Environment for Automated UI Testing - kloia Blog
No Comments Yet
Let us know what you think