
.svg "kloia.png")
By Serhat Düzen on Oct 8, 2026, 1:19:33 PM

From a Trace to the Questions Your Business Asks
In the first post of this series, "Real User Monitoring with OpenTelemetry-1" (Your Dashboards Are Green. Your Users Are Still Waiting.), we built a small lab, put a browser and a backend in one trace, and drew a first dashboard. This post picks up from there.
A trace tells you what happened to one request. People outside engineering ask other questions: can customers log in, did the app feel fast, what do they search for and put in the basket, who are they and on what device. Here we turn the same data into answers to those, join a click to the requests it causes, and list what to check before real users are involved.
If you have not run the lab, it is one VM, four containers and about 30 minutes, and the repository has the commands. Every screenshot below comes from it.
|
What you will get from this post. Named clicks, sessions and error spans; a click joined to the requests it causes (and the cost of doing it); a business dashboard with login success, Apdex, searches, products and a funnel; device and country breakdowns, with an honest note on how we faked them; and a checklist of privacy, sampling and production traps. |
|
Words you will see. Trace: the story of one request, from the click to the database. Span: one step in that story, such as the browser's wait or the server's work. Collector: a small service that receives these records and passes them on. Tempo: where the traces are stored. TraceQL: the language for searching traces and turning them into graphs. p95: the wait that 95% of requests beat; the slowest 5% take longer. Apdex: a score from 0 to 1 for how fast the app felt. Session: a random visit number, not a person. |
|
Not a developer? The grey boxes are the real code and configuration. You can skip them: the sentence before each one says what it does, and every change has a page in the repository with the original beside the changed version. |
Make the data answer business questions
The first dashboard was correct and a bit useless. It said "clicks: 0.4 per second", and nothing about which button, or whether anyone could log in. We asked Claude to read our traces and the app's code and list what would make this useful to someone outside the engineering team, then ran every item on the lab. What follows is what held up, and the one thing that needed a workaround.
Name the clicks
A click span is called click. It carries the tag name (SPAN), a long xpath and the page URL: no label, no id. The click instrumentation has a hook that hands you the DOM element and the span, so you can describe the click without touching the app:
|
In plain words. When someone clicks, the recorder already notes that a click happened. This code adds what was clicked (the button's id or label), the page it was on, and, for the basket button, which product. It also renames the record from "click" to something like "click Add to Basket". |
| ts: tracer.ts (abridged) |
|
shouldPreventSpanCreation: (event, element, span) => { const d = describe(element) // closest button or link: id, aria-label, text, routerLink span.setAttribute('ui.element.id', d.id) span.setAttribute('ui.element.label', d.label) span.setAttribute('ui.element.href', d.href) span.updateName(`${event} ${d.id || d.label}`) return false // false = keep the span } |
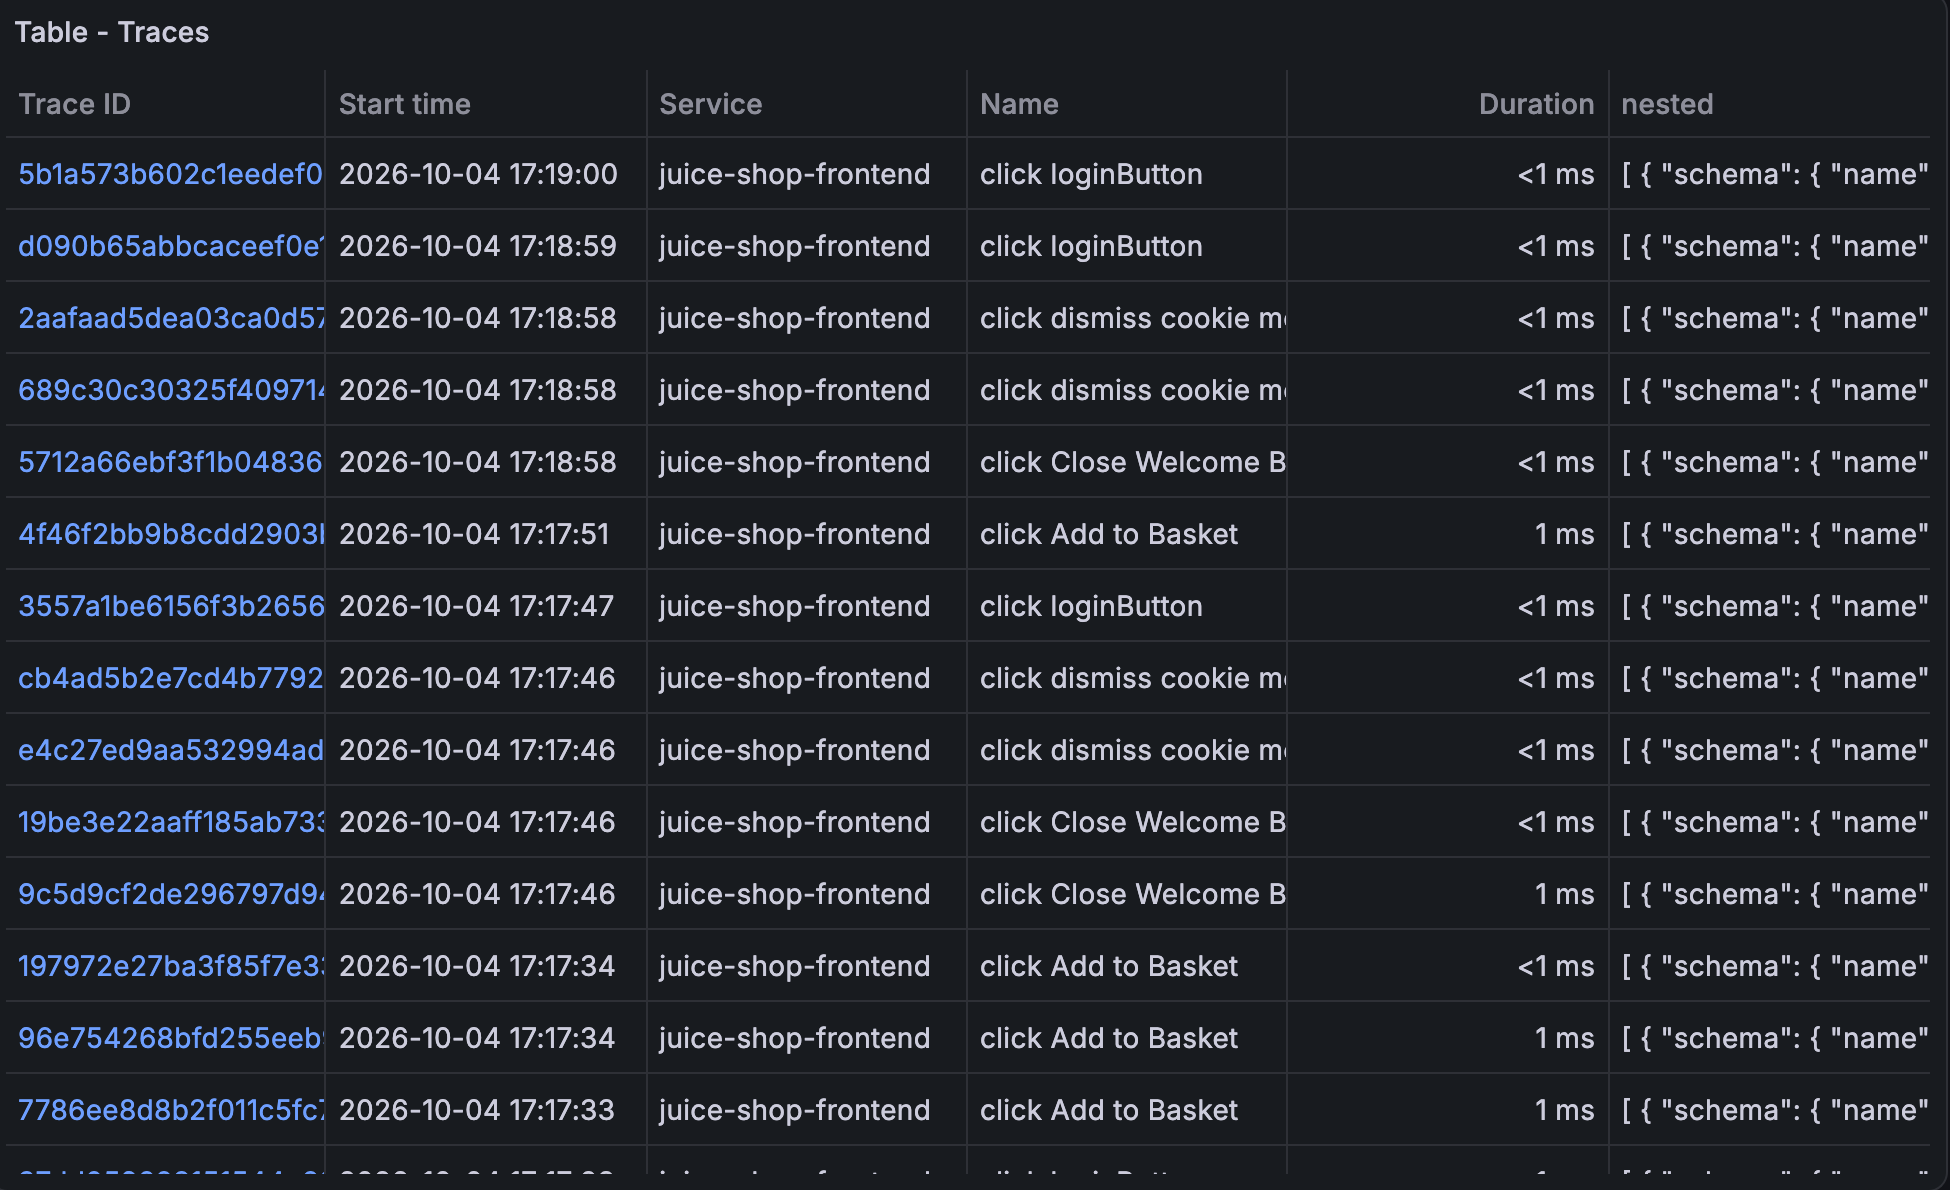
Before, every row here was just "click". After: click loginButton, click Add to Basket, click dismiss cookie message.
- Prefer ids. Add to Basket has no id and a translated label, so its name changes with the user's language. loginButton does not.
- Names are data now. Renaming spans broke our own Click rate panel, because it filtered on name = "click" and showed a flat zero. It filters on the event_type attribute now.
- Login is not a click. It runs on the form's submit event, so the instrumentation listens for both.
Count page views, and know the session
documentLoad fires once per tab, and this shop moves between pages by changing the URL hash, so after the first load nothing says where the user went. A hashchange listener adds a navigation span, with ids in the route collapsed so /order-completion/5267... does not become a new route per order. A small span processor also stamps every span with a random session.id and a user.logged_in flag, nothing more:
|
In plain words. This notes each page the visitor moves to, and stamps every record with a random visit number and whether they are logged in. It never stores a name or an email address. |
| ts: tracer.ts (abridged) |
| window.addEventListener('hashchange', () => { tracer.startSpan('navigation', { attributes: { route: currentRoute() } }).end() }) // every span also gets: session.id (random, per tab) and user.logged_in (token present?) |
No email and no user id leave the browser. That is a choice, and an easy one to undo by accident later.
Catch what breaks
None of the instrumentations records JavaScript errors, so a user can hit a broken page and the dashboard stays quiet. A listener on error that emits an exception span fixes part of it. A second listener, for unhandledrejection, never fired in the lab, because Angular's zone.js handles rejected promises itself. If you need them, catch rejections yourself.
Join a click to the requests it causes
By default a click and the request it triggers are separate traces. The user-interaction instrumentation makes the click span active only while the event handler runs, and Angular issues the fetch outside that context, so the Fetch instrumentation finds no parent. The fix we tried is small: remember the last click or submit span, and run fetch inside its context if the call starts within 300 ms of it:
|
In plain words. When the page asks the server for something right after a click, this code says "that request belongs to that click". It decides by timing alone: anything within a third of a second counts. |
| ts: tracer.ts (abridged) |
| lastClick = { span, at: performance.now() } // inside the click hook const instrumentedFetch = window.fetch window.fetch = (...args) => { if (lastClick && performance.now() - lastClick.at < 300) { const ctx = trace.setSpan(context.active(), lastClick.span) return context.with(ctx, () => instrumentedFetch.apply(window, args)) } return instrumentedFetch.apply(window, args) } |
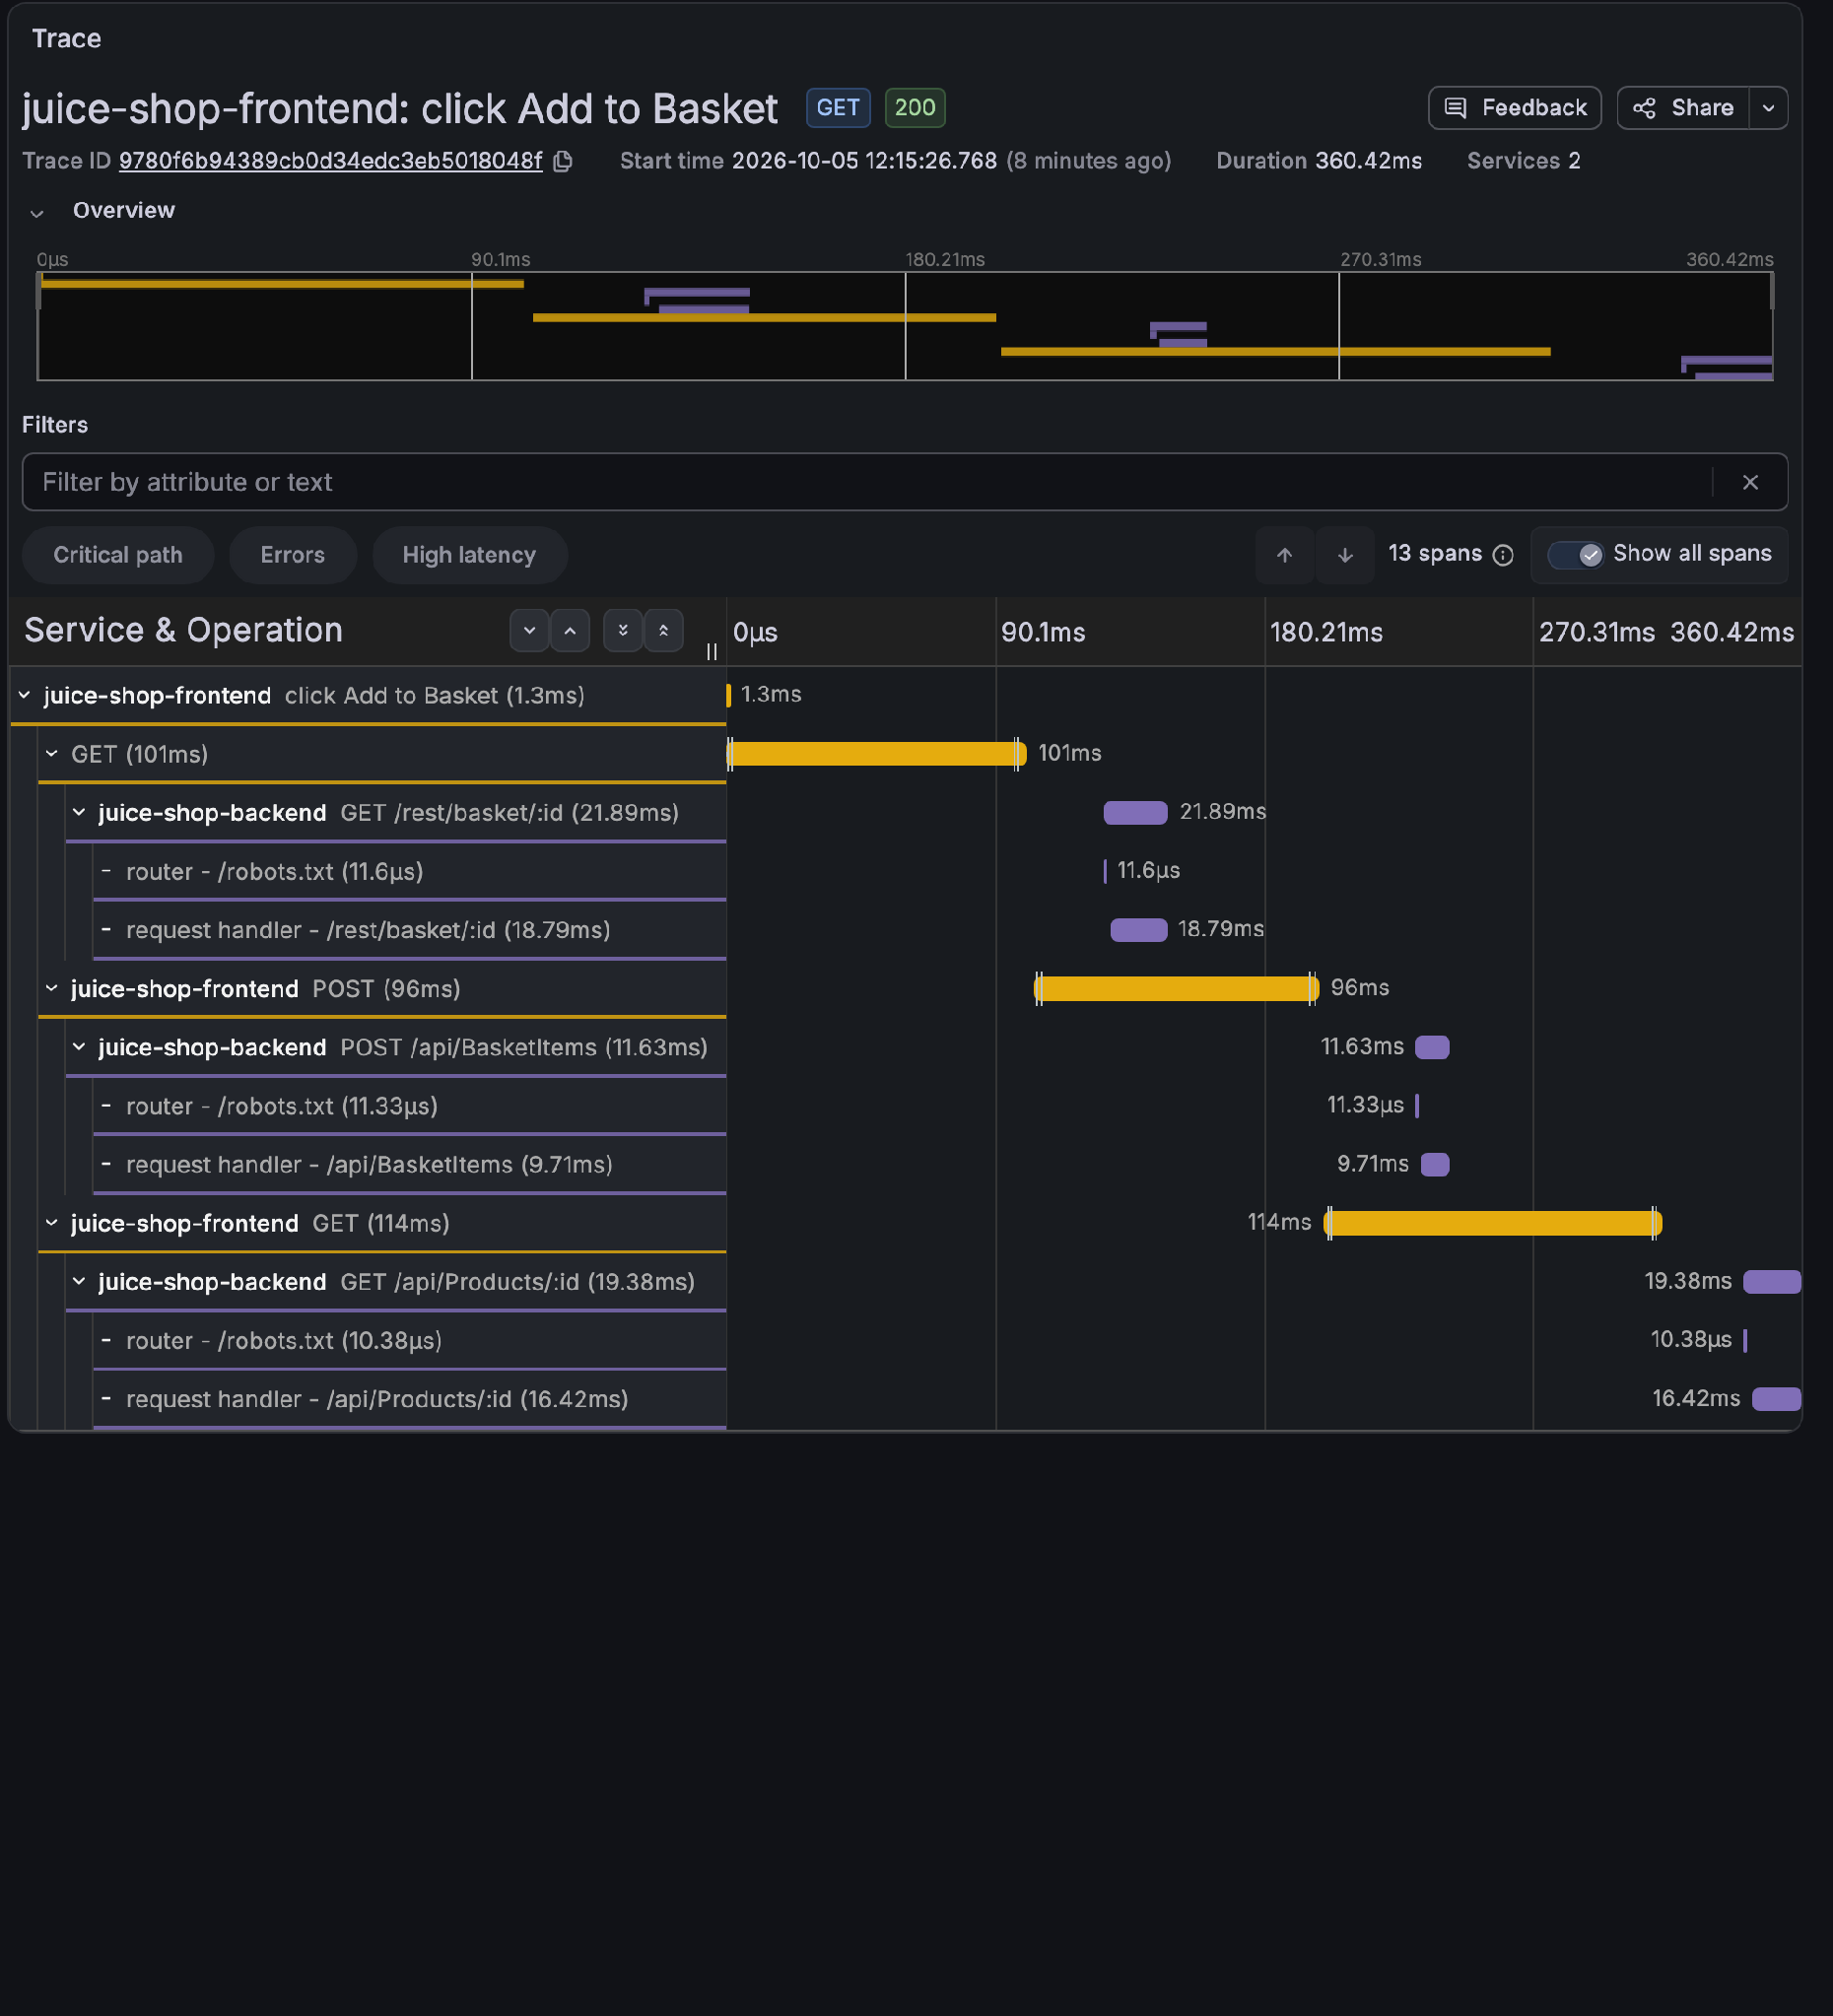
One trace: the Add to Basket click, the two requests it caused, and the backend's span under each.
Over three rounds of six scripted shoppers, the login form's submit became the parent of the login request 30 times out of 30, and click Add to Basket of the basket request 17 times out of 20. Without the wrapper, none of the click traces we inspected had a child.
|
Know the cost. This is a time window, not causality. Any request that starts within 300 ms of an interaction is adopted by it, whether or not the interaction caused it: one cookie-banner click adopted a request our test script made on its own, and every login adopted the page reads that follow it. Traces get bigger, and the dashboards are unaffected because they read the fetch and server spans, which did not change. If you control the framework's change detection (Angular's NgZone, for example), hooking there would be more exact; we did not try it. |
The business dashboard
All of this feeds a second dashboard, rum-business.json, in the same RUM folder. The first answers "what is happening"; this one answers "does it matter". Every number comes from spans we already had plus two small attributes (product.name and search.term). We generated the traffic with six scripted shoppers, each with their own searches, wrong passwords, basket and decision to buy, so we knew what each number should be.

Login success, Apdex, basket to order, API errors. Each tile is one TraceQL query.
|
Tile |
What it tells you |
How it is computed |
|
Login success |
Can people sign in? A drop means a bad release, a broken identity provider, or a wave of wrong passwords |
Logins answered 200 / all logins, from the backend's /rest/user/login spans |
|
Apdex |
One number for "did the app feel fast", from 0 to 1 |
Browser fetch spans: under 500 ms counts 1, under 2 s counts one half, slower counts 0 |
|
Basket to order |
How many items added turn into orders |
Orders placed / items added to a basket, as rates |
|
API errors |
How often the browser got a 4xx or 5xx |
Failed API calls / all API calls, measured in the browser |
Each round of six scripted shoppers makes ten login attempts, six with the right password, so the tile should read 60%, and it read 60.0%. Six items go into baskets and three orders are placed, so 50% was expected, and the tile read 50.0%. In an earlier run the tiles read 58.6% and 52.9%: a rate over a sliding interval does not always line up with a count over the whole run, and a short window shows it.
Apdex in one minute
Averages hide the slow tail, and percentiles ask the reader to know what 400 ms means. Apdex does the translation. You choose a threshold T for "fast enough" (500 ms here). A call faster than T counts 1. Between T and 4T (2 s) it counts one half. Slower counts 0. The score is the sum divided by the number of calls.
|
In plain words. This counts calls that finished in under half a second as fully happy, calls between half a second and two seconds as half happy, and slower ones as unhappy, then divides by the total. The result is a number between 0 and 1. |
| traceql |
| (({ API && duration < 500ms } | rate()) + ({ API && duration >= 500ms && duration < 2s } | rate()) / 2) / ({ API } | rate()) # API = frontend && kind = client |
The lab scored 0.98. As a rule of thumb, 0.94 and up is excellent, 0.85 to 0.94 good, 0.7 to 0.85 fair and below 0.7 poor. The number is only as good as T: a checkout call and a search suggestion box should not share a threshold, so agree T with the people who own the page. The duration is what the browser measured, so a user on a slow connection lowers the score even when your servers are fine. That is the point of measuring there.
What people look for, and what they put in the basket

Left: search terms. Right: products added to the basket, from the click span's product.name.
These are the panels people outside engineering ask about first. The left one counts search terms typed into the shop's search bar; the right one counts the product name on every Add to Basket click. Side by side they raise a question a backend dashboard cannot: what people search for is not always what they buy. The numbers come from six scripted shoppers, so read the shapes, not the totals.
|
Security note. A search term is text a user typed, and the lab lowercases it, trims it and caps it at 40 characters; someone can still paste an email address into a search box. It is also not the only place the term lands: the instrumentation records the page address in url.full, which includes the query string (#/search?q=melon), and the backend's HTTP spans record the visitor's IP address as client.address and the raw url.query. Switching off search.term does not remove any of that. The lab strips query strings, fragments and the IP in the Collector before anything reaches storage, and we checked afterwards that no stored span has them. Decide what you record before you ship, tell your privacy team, and treat session.id as a pseudonymous identifier, not an anonymous one. This is engineering advice, not legal advice about GDPR or KVKK. |
- The product name comes from the page. The lab reads it from the card the button sits in (.name inside mat-card), which is specific to Juice Shop. Your page needs its own selector, or a data-product attribute you control, which is sturdier.
- Guests count too. The click span exists whether or not the shopper is signed in, so this panel sees more than the funnel does.
Where the time and the shoppers go
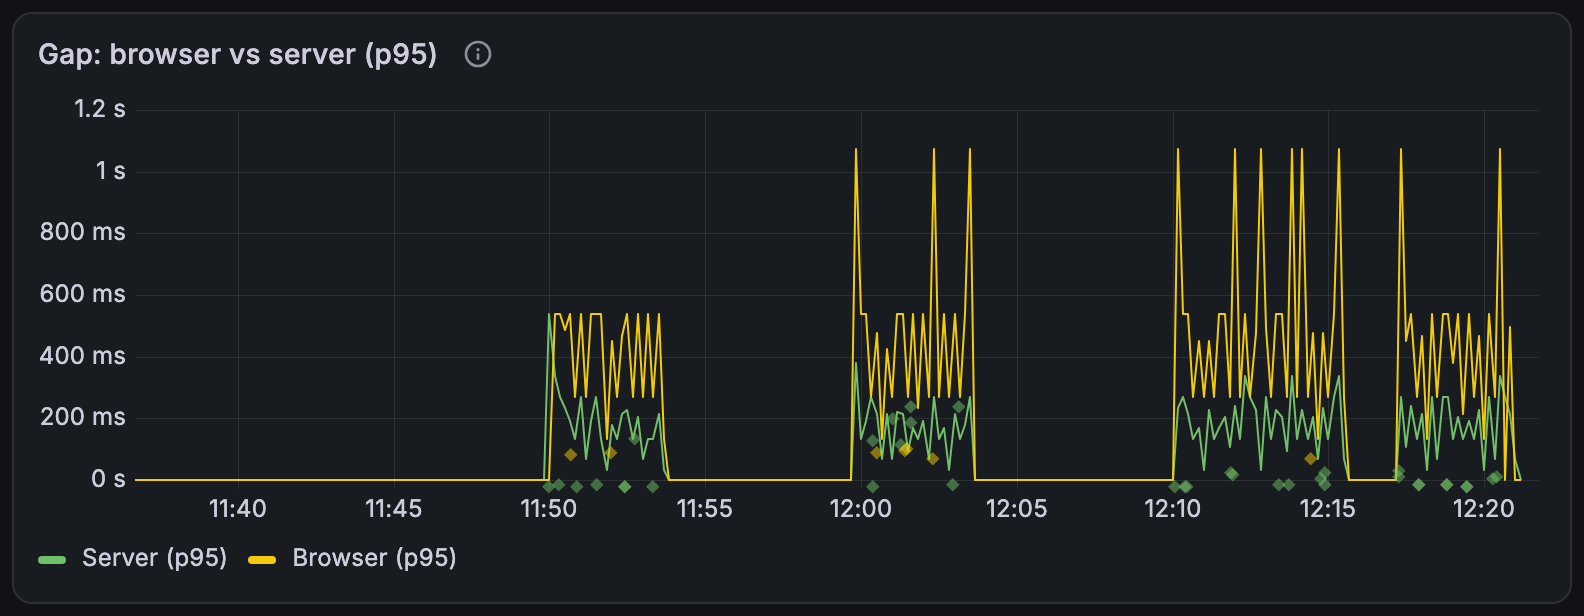
The gap panel: the same requests timed by the browser (yellow) and by the server (green).
The business dashboard also splits login attempts by status code, so a spike of 401s is its own line and does not hide inside an error rate, and it draws p50, p95 and p99 of what the browser waited for. The gap panel is the one to show first to someone who says "the servers are fine": the yellow line is above the green one, and the distance between them is the network, the browser and everything a backend trace cannot see.
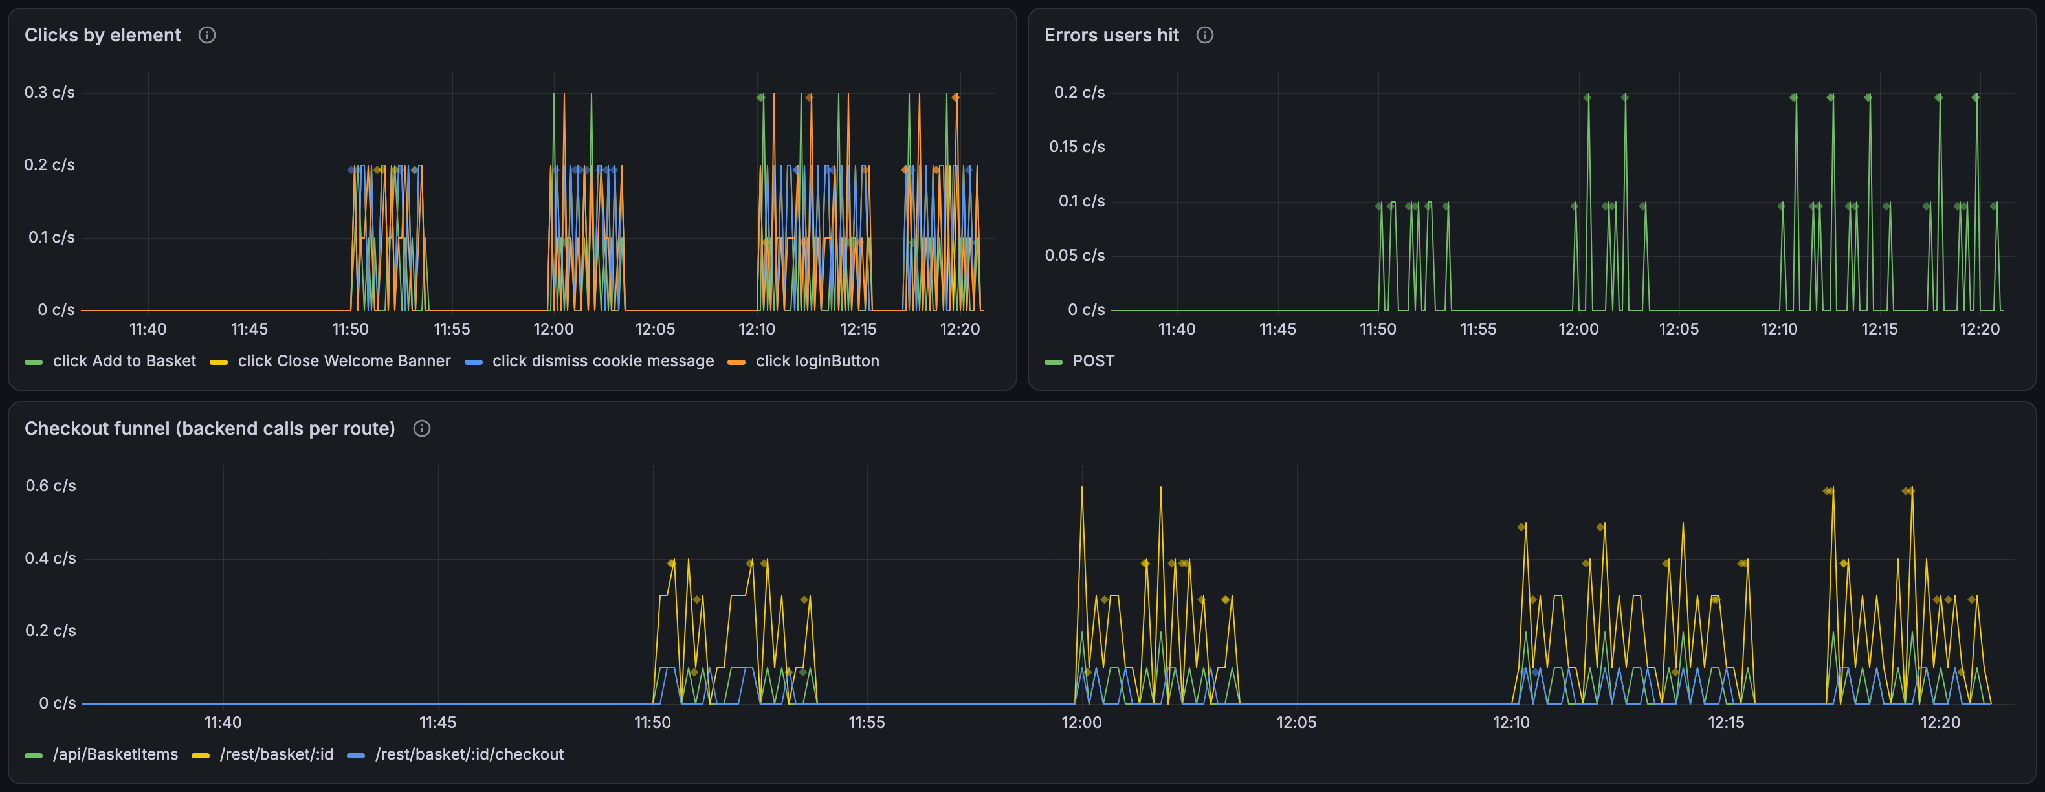
Clicks by element, errors users hit, and the checkout funnel (add to basket, view basket, place order).
The funnel draws three backend routes: add to basket (POST /api/BasketItems), view basket (GET /rest/basket/:id) and place order (POST /rest/basket/:id/checkout). Read it as three rates on one axis, not as a conversion rate: someone who adds three items and orders once counts three on the first line and one on the last. A true per-shopper drop-off needs distinct session counts, which TraceQL metrics cannot give you; query the spans and group by session.id for that.
Who your users are: device and country
Commercial RUM tools split everything by device and country. Both are within reach here. Device facts come from the browser: a few lines in the tracer turn the user agent into coarse names and attach them to every span as resource attributes.
|
In plain words. Every browser tells every website what kind of device it is. This turns that into a few coarse words, such as mobile, Safari and iOS, and attaches them to each record. Not the exact model, not the version. |
| ts: tracer.ts (abridged) |
| const ua = navigator.userAgent const deviceType = /iPad|Tablet/i.test(ua) ? 'tablet' : /Mobi|Android|iPhone/i.test(ua) ? 'mobile' : 'desktop' // ...browserName and osName the same way... resource: resourceFromAttributes({ [ATTR_SERVICE_NAME]: 'juice-shop-frontend', 'device.type': deviceType, 'browser.name': browserName, 'browser.platform': osName, 'browser.language': navigator.language, 'browser.timezone': Intl.DateTimeFormat().resolvedOptions().timeZone }) |
Names only, no versions and no full user agent: enough to split a chart, too little to fingerprint a visitor. The country needs an IP address, which browser spans do not carry. The Collector does know the address that sent the spans, so it copies it onto the span, looks the country up with its GeoIP processor, and deletes the address before anything is stored. Only the country and continent survive.
|
In plain words. The Collector knows which address sent the data. It looks that address up in a list that maps addresses to countries, writes the country on the record, and then deletes the address. |
| yaml: otel-collector-config.yaml (abridged) |
| attributes/client_ip: # browser spans only actions: - { key: client.address, from_context: client.address, action: upsert } - { key: client.address, from_context: metadata.x-forwarded-for, action: upsert } geoip: context: record providers: { maxmind: { database_path: /etc/otelcol/GeoIP2-City-Test.mmdb } } # then transform/scrub deletes client.address, city, postal code and coordinates |

Page loads and Apdex by device, and page loads by browser. Devices are emulated; mobile ran on a throttled network.

Page loads and Apdex by country. Countries are simulated with test IP addresses.
Six scripted shoppers on emulated devices, the three mobile ones on a throttled connection (150 ms extra latency, 1.6 Mbit/s). It shows. Mobile scored an Apdex of 0.93 against 0.96 for desktop, and its p95 wait was about 0.83 s against 0.54 s. The two lowest countries are the ones whose shoppers were on those slow phones, which is the lesson of this panel: a country breakdown often shows you a device or network problem first.
The countries are simulated because the lab uses MaxMind's public test database, which knows only a few documentation addresses, and the shoppers send those in x-forwarded-for. The GeoIP processor is alpha and accepts only MaxMind City databases; free alternatives in the same file format do not load. For real data you have these options:
|
Option |
What it takes |
|
MaxMind GeoLite2-City |
A free MaxMind account and licence key; accept the EULA; the file may not be redistributed, so download it at deploy time |
|
MaxMind GeoIP2 City |
Paid; more accurate |
|
A country header from your CDN or load balancer |
Read it with from_context: metadata.<header> and skip the database entirely |
|
browser.timezone alone |
No database and no IP; a region, not a country |
Trust x-forwarded-for only when your own load balancer sets it; a browser can send any value it likes. Session replay is the one commercial feature we would not try to rebuild here: it records the page itself, which means separate storage, masking every input, and a much bigger privacy question.
Each change in this post is written up with the original and the new version side by side:
|
What |
In plain words |
Before and after |
|
Named clicks, sessions, errors, click-to-request link (tracer.ts) |
Makes each record say what was clicked and ties a click to the requests it caused |
|
|
Business dashboard |
The tiles, the Apdex and the funnel, with every query |
|
|
Device and country |
Adds device facts in the browser and a country in the Collector |
|
|
Removing personal data (Collector) |
Deletes addresses and query strings before storage |
Before you take this to production
The lab ran at 100% of traffic on one VM. Before you point real users at something like it:
- Privacy comes first. Read the security note above again, then check what your own pages put in URLs, labels and form fields. Scrub in one place you control: the Collector's transform processor is a single, reviewable spot. How long your trace store keeps spans is part of what you tell your users and your privacy team.
- Sampling changes what the numbers mean. This is reasoning from how the queries work, not something we measured. With uniform random sampling, ratios such as Apdex and the error share stay roughly right and get noisier, while counts and rate() shrink by the sampling fraction, and Tempo does not scale them back up. If errors are kept at a higher rate than successes, an error share computed from the sampled spans is inflated, so compute it from a source that sees every request, such as the load balancer.
- The country lookup handles an IP address. Even though the address is dropped before storage, the Collector processes it, and that is processing personal data. Say so in your privacy notice, and keep the GeoIP processor's alpha status in mind.
- Browser traffic is a lot of spans. Every click, page view and fetch is one. Sample at the SDK (a ratio-based sampler) or filter in the Collector, and watch your trace store's ingest before launch.
- The Collector endpoint is public by design. Anyone can send it spans. Restrict the allowed origins, rate-limit in front of it, and remember that a browser cannot keep a secret.
- Know what the dashboards cannot say. Quantiles are estimates (Tempo uses log-scale buckets). Rates are not users: session.id is random per tab. Guests never reach the funnel. The click-to-request link is a time window.
Taking this to your own app
If we were starting on your app, this is the order we would follow, and where we would stop if time ran out:
- Basics. Page load, click and fetch spans, an exporter that does not point at localhost, and CORS on the Collector. You get the browser half of every trace.
- Join the backend. Make sure traceparent reaches your API and that server instrumentation starts before your framework. Check one trace and look for two services.
- Name things before you chart them. Give clicks a stable name (an id, not a translated label), collapse ids in routes, add a random session id. This is cheap early and expensive to retrofit.
- Decide what you will not record. Input values, emails, tokens, free text. Write it down in the repo. It is the part most likely to drift.
- Pick the three numbers your team will look at. For most web apps: login or sign-up success, an Apdex per critical flow, and the error rate users hit. Add panels when someone asks for them.
- Set T with the page's owner. An Apdex threshold nobody agreed to is just a number.
- Then add what is specific to you: product or plan names on the click that matters, search terms if you are comfortable with them, Core Web Vitals, sampling.
Support gets to answer "it feels slow" with a measurement from a real browser. Product sees what people search for and add. Engineers see the gap between the browser and the server, which is where "it is fine on our side" stops being enough.
One more thing that bit us
- Our own dashboard legend was unreadable. Tempo ignores legendFormat, so the gap panel showed {p=0.95, resource.service.name="juice-shop-backend"}. A field override with displayName renames the series.
Try it, and tell us what you find
If you want to see the gap in your own world, run the lab, then point the same ideas at one page of your own app for a day. The whole setup is in one repository: Terraform for the VM, the Compose stack, the overlay with the instrumentation, both dashboards, and one before-and-after file per change. A star on the repo helps others find it.
We would like to hear what you find. How far apart are the browser and server medians on your busiest route, and which page is the worst offender? If you would rather not set this up alone, Kloia's observability team builds this kind of browser-to-backend tracing alongside your own people; get in touch.
References
- Companion repository: https://github.com/kloia/observability-opentelemetry-rum-demo
- Kloia: Zero-Code Observability on Linux VMs with the OpenTelemetry Injector
- OpenTelemetry Web SDK: opentelemetry.io/docs/languages/js/getting-started/browser
- Node auto-instrumentation: github.com/open-telemetry/opentelemetry-js-contrib
- W3C Trace Context: w3.org/TR/trace-context
- Tempo TraceQL metrics: grafana.com/docs/tempo/latest/traceql/metrics-queries
- OWASP Juice Shop: github.com/juice-shop/juice-shop

Real User Monitoring with OpenTelemetry - I

Zero-Code Observability: Context Propagation and Log-Trace Correlation with eBPF

No Comments Yet
Let us know what you think