
.svg "kloia.png")
The Problem
No company context
AI tools write code without knowing your codebase, your specs, your stored procedures, your standards. Generic in, generic out.
Zero audit trail
Nobody knows what changed, by whom, against which spec, at what cost. When something breaks, the log is empty.
Knowledge stays siloed
The senior engineer's head is still the source of truth. The pipeline learns nothing. That person leaves, the knowledge walks out.
Pilot never becomes default
The shiny demo works. Then adoption stalls. The new way of working never replaces the old one.
Why AIDLC?
Faster delivery
Tens of dollars per feature, hours of elapsed time. Not weeks.
Built-in compliance
Every action audited. Every dollar attributed to an issue.
Institutional memory
The pipeline learns. The org's knowledge stops walking out the door.
Faster onboarding
New engineers ramp on a pipeline that already knows the codebase.
A pipeline that improves
Each cycle's retro feeds the next cycle's configuration.
Humans stay in control
Agents propose. Humans approve. Every merge is gated.
Problems
No company context
Zero audit trail
Knowledge stays siloed
Pilot never becomes default
Why AIDLC?
Faster delivery
Built-in compliance
Institutional memory
Faster onboarding
A pipeline that improves
Humans stay in control
OpenTelemetry:
Baked in, not bolted on
Auto-instrumentation of .NET and Java services → ADOT collector sidecars on EKS → AWS X-Ray for distributed tracing → CloudWatch for metrics and logs → custom dashboards and SLO alerting. All traces, metrics, and logs flow through a single OTel pipeline, swap backends without re-instrumenting.
VM → Container replatforming
Move off bare VMs onto EKS with proper orchestration, autoscaling, and workload isolation.
Custom metrics
Business and technical KPIs exported via OTel metrics SDK to CloudWatch and Managed Prometheus.
Structured logging
JSON-structured logs with trace correlation IDs, shipped to CloudWatch Logs Insights.
SLO alerting
Composite alarms and SLO burn-rate alerts wired from day one not as an afterthought.
What changes in your architecture
AWS Landing Zone & multi-account governance
AWS Control Tower
Security baseline
Identity & access
Network architecture
FinOps & cost governance
Compliance as code
Measurable results our clients achieve
60-80%
infrastructure cost reduction vs on-prem VMs
10x
faster deployments via GitOps pipelines
99.9%+
availability through EKS self-healing & multi-AZ
<5 min
MTTR with full OTel trace-to-log correlation
Case Study — LUMO
Open-Source Observability Transformation on AWS
68%
Cost Saving
99%
Telemetry Delivery Rate
Client: Lumo
Project type: Observability on AWS
Website: www.lumo.ag
Situation
Lumo is a California-based agricultural technology company. It builds cloud-based solutions that help growers monitor, control, and optimize water usage at scale.
Lumo ran a vendor-based observability solution to collect logs, metrics, and traces across all AWS EKS environments. As platform usage grew, this model created financial and operational pressure.
Usage-based pricing made observability costs unpredictable and rising. Log ingestion created end-of-month billing uncertainty. A single-vendor dependency reduced architectural flexibility. Scaling observability meant scaling cost at the same rate.
Task
Move from Datadog to a cost-predictable, open-source observability platform. Keep full visibility at every stage of the transition.
The work carried hard constraints:
- Observability had to stay fully available during the migration.
- Applications were already instrumented and running in production.
- Telemetry needed centralized governance and consistent enrichment.
- Retention and data growth required tighter control without licensing limits.
Action
Lumo designed and implemented a centralized, open-source observability platform on AWS. The vendor-based model was replaced without disrupting production workloads. The focus was ownership, cost predictability, and platform-level observability.
How it was built:
A dedicated central observability backend on Amazon EKS, isolated from application workloads.
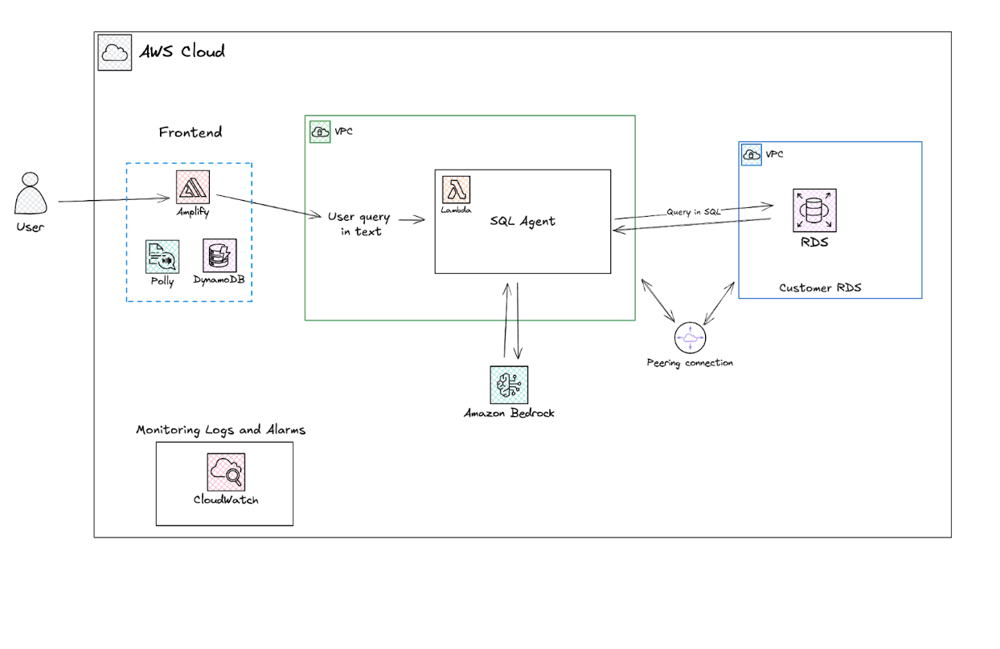
AWS Cloudfront
Used for hosting the static web assets of the React-based chatbot frontend.
AWS CloudWatch
Implemented for monitoring application performance, logging, and system health.
AWS Lambda
Hosting the SQL Agent + connection to the databases.
AWS Relational Databases
For the customer databases
AWS Relational Databases
For the customer databases
A dedicated central observability backend on Amazon EKS, isolated from application workloads.
AWS Cloudfront
Used for hosting the static web assets of the React-based chatbot frontend.
AWS CloudWatch
Implemented for monitoring application performance, logging, and system health.
AWS Lambda
Hosting the SQL Agent + connection to the databases.
Results
The transformation made observability a platform-owned capability instead of a per-application or vendor-managed service.
- Zero observability gaps during migration.
- Full removal of vendor-specific agents.
- Predictable and controllable observability costs.
- Centralized governance with distributed telemetry collection.
- Improved operational clarity and faster incident response.
Monthly observability cost is now fixed at $475. No application code was changed during the migration. Logs are retained for 15 days and traces for 7 days, which is sufficient and fully controlled.
Case Studies

Open-Source Observability Transformation on AWS
Open-Source Observability Transformation on AWS