
.svg "kloia.png")
By Serhat Düzen on Sep 16, 2026, 2:28:02 PM

Elasticsearch is where most teams already keep their application and infrastructure logs. But logs are not dashboards, and they are not alerts - turning "how many failed logins happened in the last 15 minutes" into something a NOC or SOC team can watch in real time usually means someone opens Kibana, writes a query, and repeats that by hand every time they want a fresh answer.
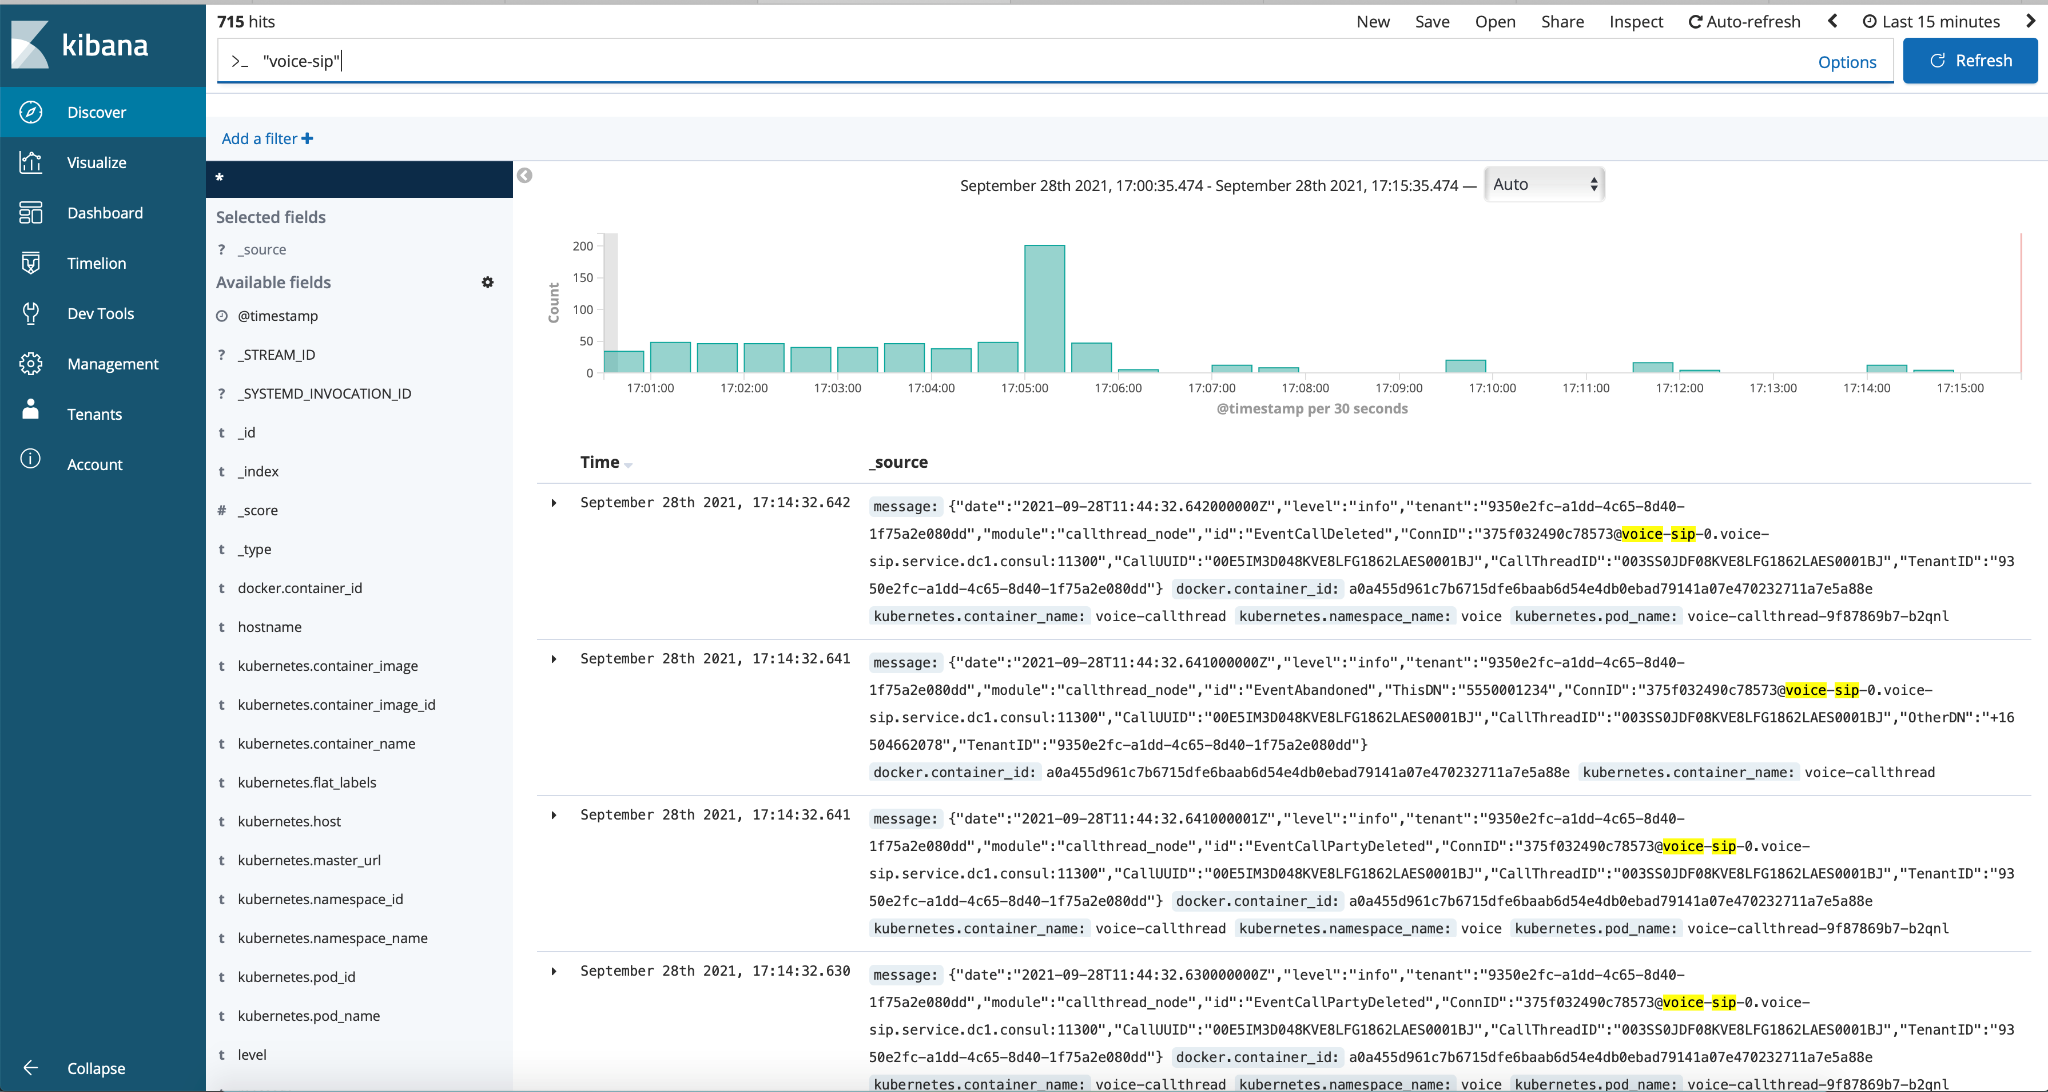
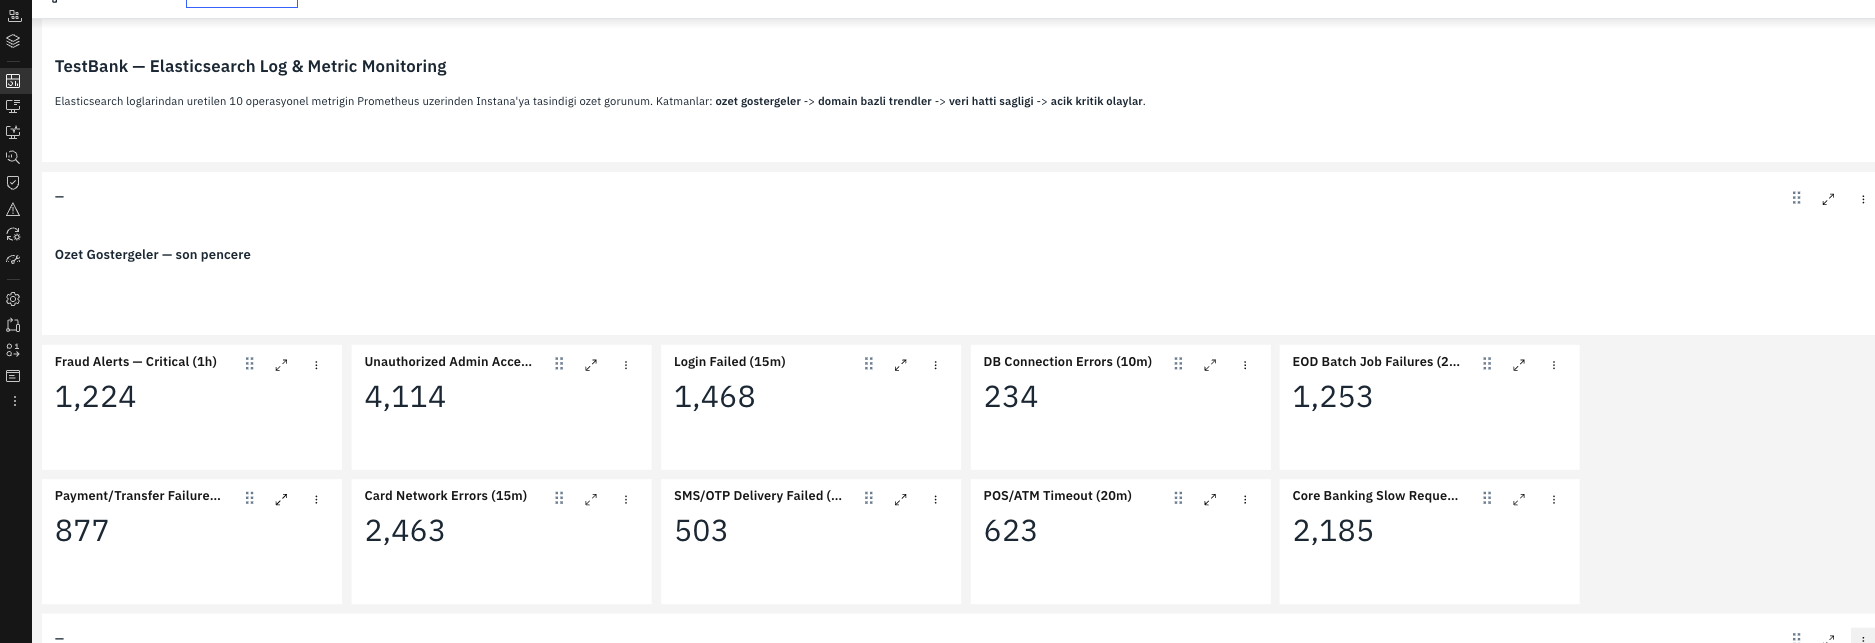
This post walks through a pattern that bridges the functional gap between static log storage and real-time operational visibility - especially valuable for teams running free or basic Elasticsearch clusters without enterprise alerting features. Without touching how Elasticsearch is deployed or how logs are shipped, a lightweight exporter executes scheduled Elasticsearch queries, converts the results into Prometheus metrics, and allows Instana's Prometheus sensor to scrape them. The result is instant transform of log-derived counts into actionable Instana dashboards and Smart Alerts, removing the need for ad-hoc log queries during incidents.
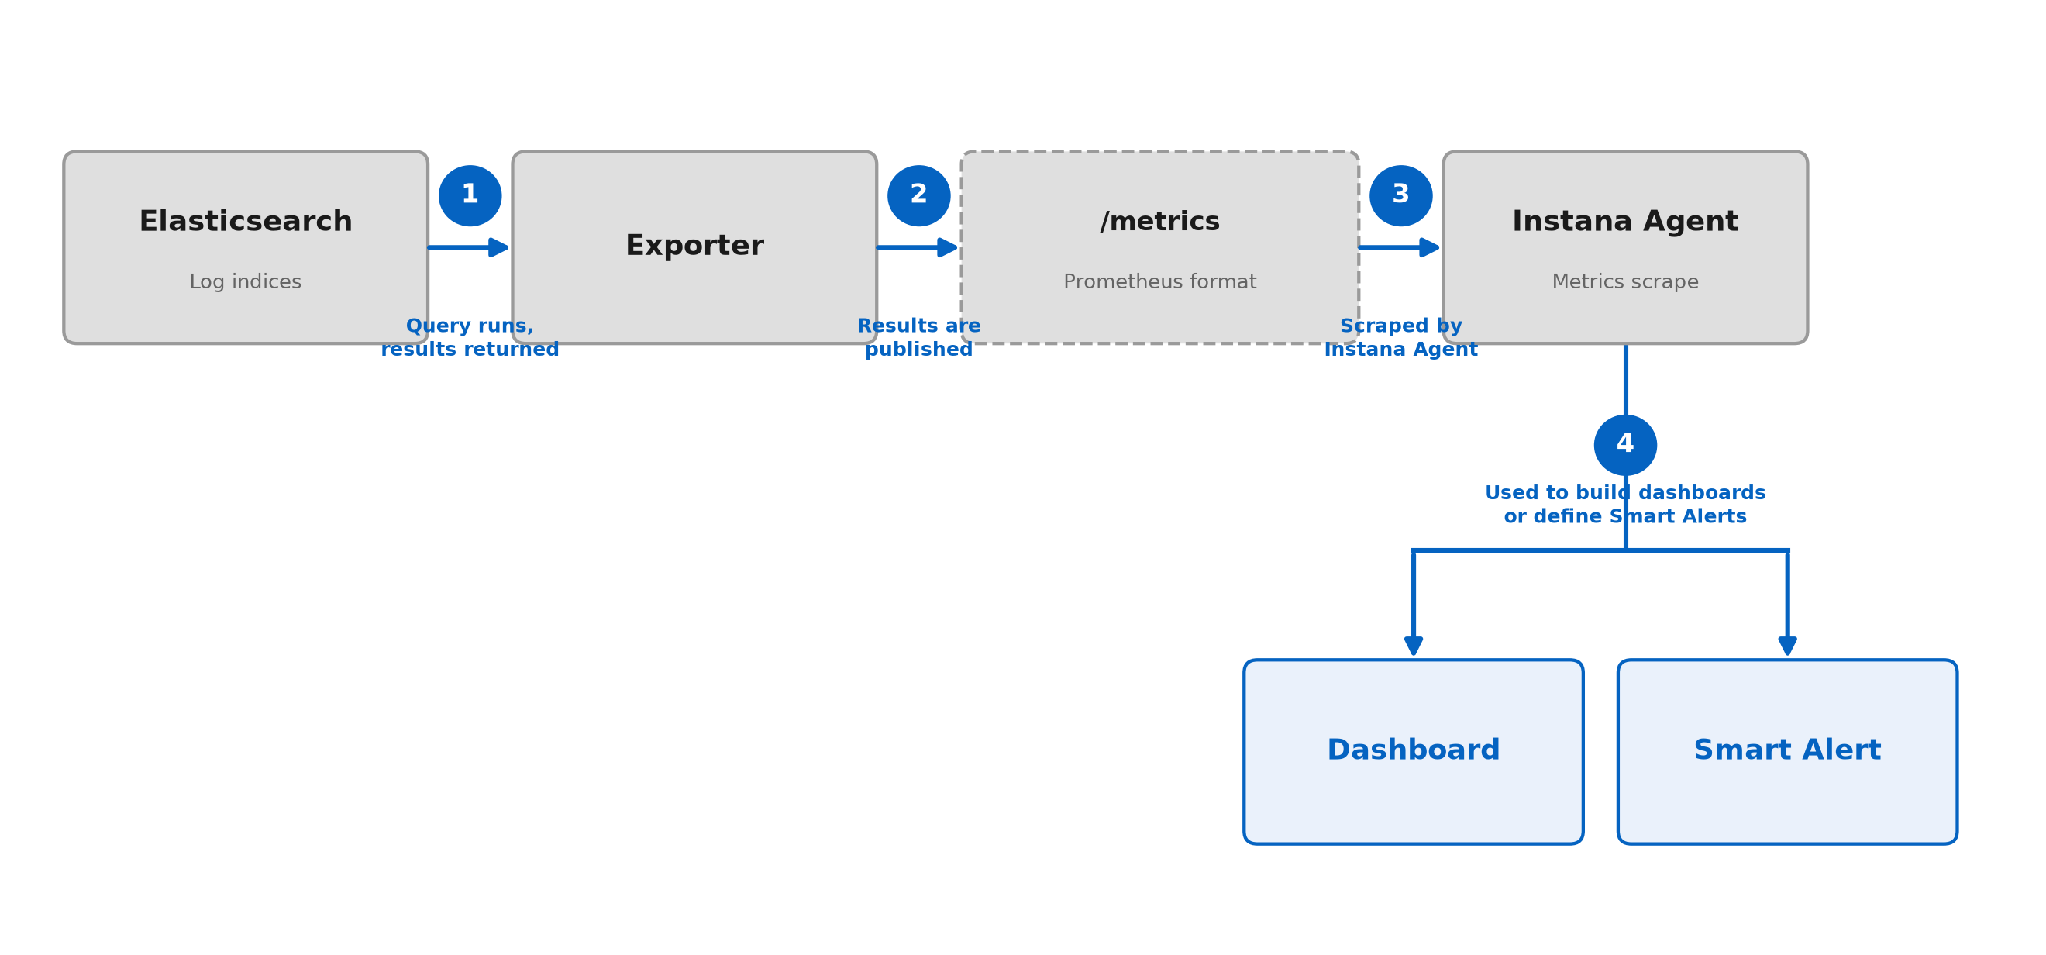
Elasticsearch log indices to Instana, in four steps
Why Convert Log Queries into Metrics?
A log line is evidence that something happened once. A metric is a running answer to a question you asked in advance - "how many of X in the last N minutes." By transforming raw log entries into structured business metrics, you unlock the ability to establish clear operational dashboards, configure threshold-based alerts, and monitor service performance against strict SLOs. Re-running an Elasticsearch query every time someone wants to see a number does not scale past a handful of viewers, and it leaves monitoring tools without a lightweight, pollable data source.
The pattern here inverts that: define the questions once as Elasticsearch queries, run them on a fixed interval, and publish the answers as gauges. From that point on, Instana (or any Prometheus-compatible tool) treats them exactly like any other metric - no knowledge of Elasticsearch's query DSL required downstream.
How It Fits Together
Four steps, none of which require changing how logs are produced or stored:
- A scheduled Elasticsearch query runs against one or more log indices and returns a hit count for a defined time window.
- An exporter process publishes that count as a Prometheus-format metric on an /metrics HTTP endpoint.
- Instana's host agent scrapes that endpoint on its own polling interval, alongside any other Prometheus targets it already watches.
- The resulting metric is available in Instana like any other - build a dashboard widget from it, or attach a Threshold or Anomaly-based Smart Alert.
Where This Pattern Earns Its Keep
A few recurring scenarios where teams already have the right logs in Elasticsearch, but no standing way to watch them as numbers:
- Authentication anomalies
- A sudden spike in failed login attempts within a short window is a brute-force signature - worth a metric on its own, independent of any application-level rate limiting.
- Downstream integration failures
- Payment gateways, card networks, SMS/OTP providers - anything external that occasionally fails in bursts benefits from a count-over-time view rather than a log line per failure.
- Infrastructure degradation signals
- Database connection pool exhaustion, growing response-time logs, timeout messages - these already exist as log lines long before a host- or process-level metric would catch them.
- Batch and scheduled job outcomes
- End-of-day or nightly job failures are naturally log-shaped (one line, once a day) but still deserve a dashboard tile and an alert if they don't run clean.
- Security and compliance events
- Unauthorized access attempts against sensitive endpoints, or rule violations from a fraud/risk engine, are exactly the kind of event a security team wants counted and watched, not searched for after the fact.
Prerequisites
- An Elasticsearch cluster with the log indices you want to query already populated.
- Docker (or another way to run the exporter process) on a host that can reach both Elasticsearch and, outbound, Instana's ingest endpoint.
- An Instana host agent, or the ability to deploy one, on that same host.
- A clear list of the questions you want answered - each one becomes one query and one metric. Write these down before touching any config; the exporter step below is mechanical once the questions are defined.
Step 1 : Turn Each Question into an Elasticsearch Query
This example uses braedon/prometheus-es-exporter, which reads its query definitions from an INI-style config file (not YAML - worth checking for any exporter you pick, since config formats vary and a mismatch here fails silently at parse time). Each section becomes one metric; with no aggregation defined, the exporter publishes the query's hit count as <section-name>_hits:
| [DEFAULT] QueryIntervalSecs = 30 QueryTimeoutSecs = 10 QueryOnError = zero QueryOnMissing = zero ; "failed logins in the last 15 minutes" [query_auth_login_failed_15m] QueryIndices = auth-logs-* QueryJson = { "size": 0, "query": { "bool": { "filter": [ {"term": {"event.action.keyword": "user_login"}}, {"term": {"status.keyword": "FAILED"}}, {"range": {"@timestamp": {"gte": "now-15m"}}} ] } } } |
- QueryIntervalSecs - how often the question gets re-asked. Match it to how fast the signal actually needs to move, not a single global default for every query.
- QueryOnError/QueryOnMissing - set to zero rather than drop for anything feeding a dashboard, so a transient Elasticsearch hiccup shows as 0, not a gap that reads as "no data" to a viewer.
- Scope QueryIndices per query rather than one shared index pattern for everything - it keeps each metric's query fast, and makes the mapping between metric and index obvious to the next person reading the config.
Step 2 : Deploy the Exporter
A minimal Docker Compose service for the exporter above, pointed at the config file from Step 1:
| services: prometheus-es-exporter: image: braedon/prometheus-es-exporter:0.14.1 command: ["-p", "9108", "-e", "elasticsearch:9200", "-c", "/etc/exporter/queries.cfg"] volumes: - ./queries.cfg:/etc/exporter/queries.cfg:ro ports: - "9108:9108" |
Verify it before wiring Instana in - a plain curl against the endpoint is the fastest way to confirm the queries are actually returning data:
| curl -s http://localhost:9108/metrics | grep auth_login_failed |
Expect output like auth_login_failed_15m_hits 12.0. If every metric reads 0 immediately after startup, that can simply mean the exporter hasn't completed its first query cycle yet - give it one full QueryIntervalSecs before treating a 0 as a broken query.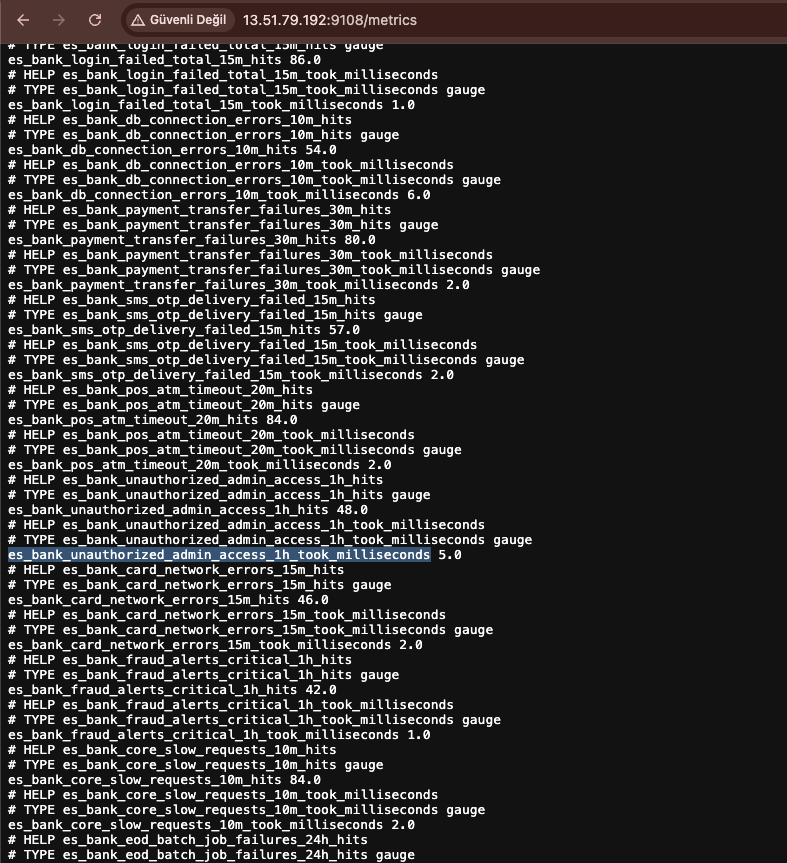
Step 3 : Point Instana's Prometheus Sensor at the Exporter
Instana's host agent has a built-in Prometheus sensor that polls arbitrary /metrics endpoints - no Prometheus server required in between. Add a named configuration extension file (never overwrite the agent's own configuration.yaml directly - extend it with a configuration-<suffix>.yaml, so an agent update doesn't clobber it):
| com.instana.plugin.prometheus: poll_rate: 15 customMetricSources: - url: 'http://localhost:9108/metrics' metricNameIncludeRegex: '^auth_|^payment_|^batch_' |
metricNameIncludeRegex is worth setting deliberately rather than leaving unset - an exporter that also emits its own process-level metrics (process_*, language-runtime GC stats, and similar) will otherwise mix operational noise from the exporter itself into a dashboard meant to show business signals.
Mount the file into the agent container's config directory and confirm from the agent's own logs that it parsed correctly and started scraping - both are logged at startup:
| docker logs instana-agent 2>&1 | grep -iE 'Parsed configuration|Activating Prometheus Sensor' |
Step 4 : Build Dashboards and Smart Alerts
Once Instana is scraping the endpoint, each metric behaves like any other custom Prometheus gauge: it can be dropped into a custom dashboard widget, grouped alongside related metrics on the same time axis, or attached to a Smart Alert.
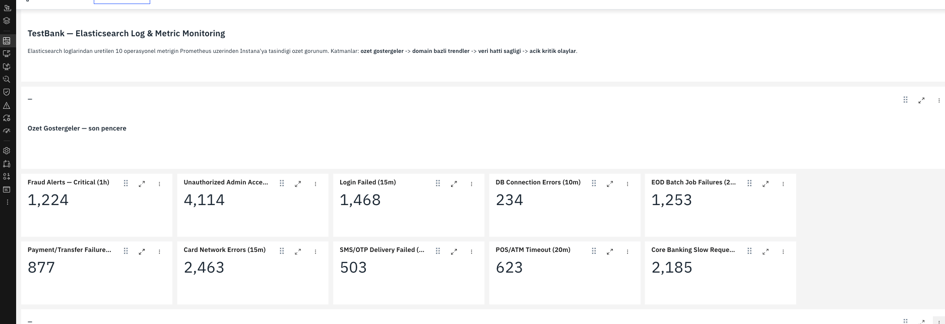
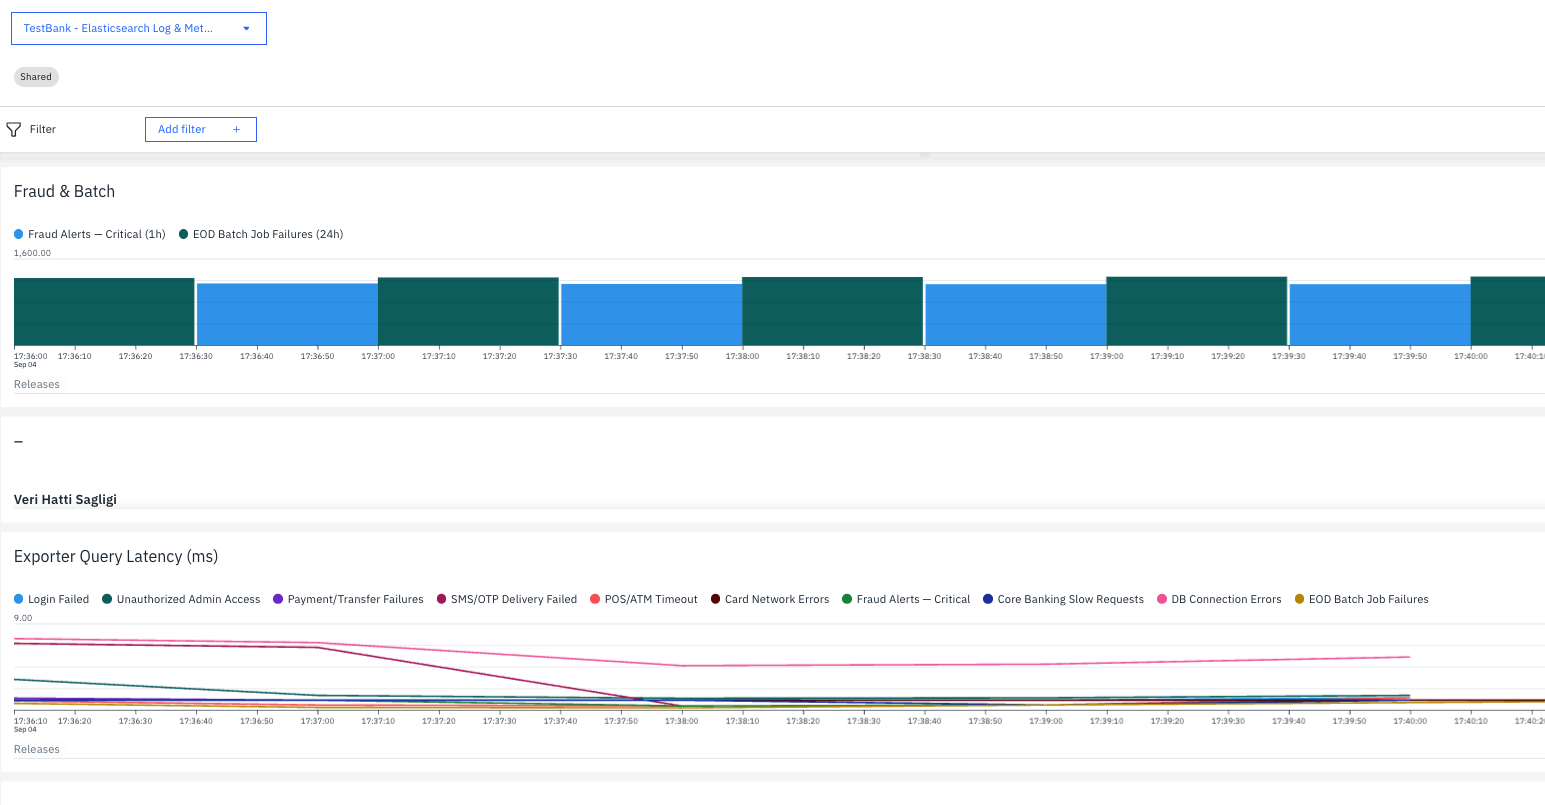
Two alerting shapes are worth distinguishing, since they solve different problems:
- Threshold-based alerts
- A fixed, team-defined limit - "more than 200 failed logins in 15 minutes." Simple, predictable, and the right choice when the acceptable range is already known.
- Anomaly-based Smart Alerts
- Learn a metric's normal range and flag a sudden, statistically unusual deviation instead of a fixed number. Useful for signals whose normal volume varies by time of day or day of week, where a single static threshold is either too sensitive at quiet times or too loose at busy ones.
A gauge that represents "count in the last N minutes" - as opposed to a monotonically increasing counter - should be aggregated with MEAN, not INCREASE or SUM, when building a widget from it: the exporter already computed the windowed count, so summing it again over the dashboard's own time range produces an inflated, meaningless number.
One Advantage Worth Naming Directly
Elastic's own native alerting sits behind a subscription tier for its more advanced rule types - anomaly- and SLO-based rules specifically require a Platinum or Enterprise license (source: elastic.co/subscriptions). The pattern in this post sidesteps that entirely: once a log-derived signal is a Prometheus metric, both dashboarding and alerting on it happen inside whatever observability platform already holds the license - Instana in this case - with no additional Elastic subscription tier required for the alerting itself.
Challenges and Considerations
- Query cost: Every exporter poll is a real Elasticsearch query. Scope each one to a specific index pattern and a bounded time window (range on @timestamp), and set QueryTimeoutSecs below the exporter's own poll interval so a slow query can't stack up behind the next one.
- Field mapping assumptions: Dynamic mapping gives string fields a .keyword sub-field automatically - exact-match term/terms filters need to target that sub-field, not the analyzed text field, or the query silently returns zero matches.
- Metric naming drift: Keep the exporter config and whatever documents the metric-to-scenario mapping in the same place, or changed one at a time - a metric that's renamed on one side and not the other breaks silently, since the exporter and Instana have no way to cross-check it.
- Alert threshold calibration: A threshold picked before real traffic volume is known is a guess. Run the dashboard against live data first, then set thresholds - and Smart Alert baselines - from what "normal" actually looks like.
Final Thoughts
None of the individual components here are new - Elasticsearch queries, a Prometheus exporter, and Instana's Prometheus sensor are all established tools. The real value of this pattern lies in how it connects them:
- Zero Infrastructure Impact: Existing log data gains a structured, queryable metric format without altering how logs are produced or stored.
- Expanded Observability: Your primary observability platform gets a brand-new stream of operational signals to power dashboards, alerts, and SLO tracking.
- Low Implementation Lift: The exporter configuration is the only new artifact required - and it simply automates the exact queries your team is likely already running manually.
References
- https://github.com/braedon/prometheus-es-exporter
- https://www.elastic.co/docs/manage-data/data-store/manage-data-from-the-command-line
- https://www.ibm.com/docs/en/instana-observability/saas?topic=integrations-prometheus

Creating Prometheus Custom Exporters with kloia_exporter Pip Package

Kubernetes 1.34: Fine-Grained Container Restart Policies

No Comments Yet
Let us know what you think