By Muhammed Said Kaya on Dec 26, 2021 1:50:09 PM

Creating Prometheus Custom Exporters is easy. If you are using Prometheus, which is one of the most popular and most used monitoring and alerting toolkits, you don’t need to worry about creating Prometheus Client when you want to yield metrics. kloia_exporter, which is the pip package that can be used to create REST API and yield metrics to Prometheus so that you can just focus on your applications. You can import kloia_exporter and easily create HTTP API as a target to Prometheus, and whatever you want to yield, you can. For example, Metrics might be request times for a server or a number of total connected users.
Let’s see Custom Exporter in action!Example - Custom Exporter for Couchbase Metrics
I will develop a custom exporter which gets metrics from the Couchbase server by using Python SDK and yields them as a target for Prometheus.
There are some requirements to be able to develop a custom exporter. Firstly, I will install kloia_exporter from the Github kloia repository and Couchbase Python SDK.
pip3 install git+https://github.com/kloia/prometheus-custom-exporter
pip3 install couchbase
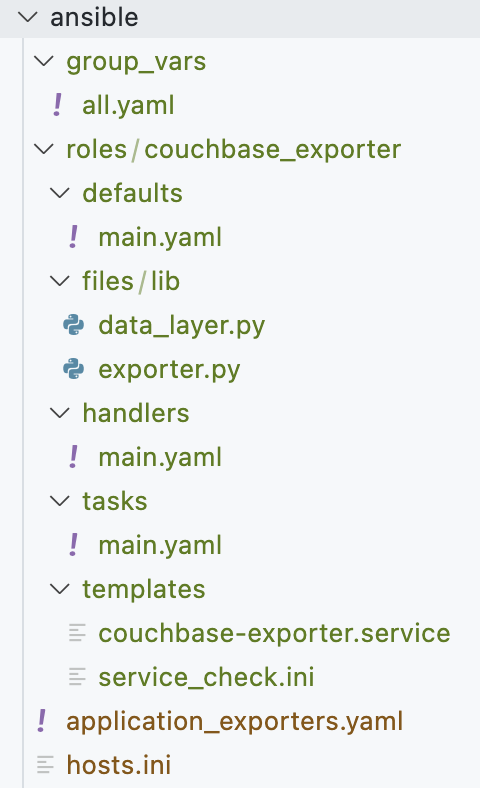
Ansible will be used for installing our custom exporter. I will create these files step by step. After that, I am going to run just the playbook. This playbook will create a Systemd Service which serves on a defined port as a target for Prometheus. Thus, I will scrape the metrics.
This is the final structure of my directory.
Step 1 - Create exporter.py
Here is the script to help you develop a custom exporter.
from kloia_exporter import API, config
from data_layer import DataLayer

couchbase_config = config.get_config_info("service_check.ini", "couchbase")

dao = DataLayer(couchbase_config)

metric_inputs = [
   {
       "metricName": "totalUsers",
       "helpText": "Total Users",
       "labels": ["labelKey"],
       "collect": lambda metricFamily:
                      metricFamily.add_metric(
                         ["labelValue"],
                         dao.get(“select count(*) from Kloia”)[0][“$1”]

                      )
   }
]

API(int(couchbase_config["port_number"]), metric_inputs=metric_inputs).listen()
Let’s go over these step by step:
from kloia_exporter import API, config
from data_layer import DataLayer
I will import the API and config classes from kloia_exporter to create REST API, which yields our metrics and reads our config files. I will also create data_layer.py in the following steps to be able to connect to the Couchbase server.
couchbase_config = config.get_config_info("service_check.ini", "couchbase")
I will get the couchbase section by reading the configuration file which is named service_check.ini. It includes some credentials and ports.
dao = DataLayer(couchbase_config)
I will connect to the Couchbase Server.
metric_inputs = [
   {
       "metricName": "totalUsers",
       "helpText": "Total Users",
       "labels": ["labelKey"],
       "collect": lambda metricFamily:
                      metricFamily.add_metric(
                         ["labelValue"],
                         dao.get(“select count(*) from Kloia”)[0][“$1”]

                      )
   }
]
I will define a list that includes objects. These objects must contain some keys metricName, helpText, labels, and the collect lambda function. By defining a collect function, Prometheus Client calls it and yields the metric from the port. In our case, I will get the count of total users on the system by querying Couchbase Server. This number will be represented as my metric.
API(int(couchbase_config["port_number"]), metric_inputs=metric_inputs).listen()
I will give the list to the API classes, which are imported from kloia_exporter package, as a parameter. It will create the Prometheus Client for me.
Step 2 - Create data_layer.py
Here is the script to connect Couchbase Server by using Couchbase Python SDK. I will give the credentials, that is on service_check.ini, as a parameter to the DataLayer object on the exporter.py. It will create a connection. This will allow me to get my metrics by writing N1QL queries.
from couchbase.cluster import Cluster
from couchbase.auth import PasswordAuthenticator
import logging

class DataLayer():

   def __init__(self, args):
       self.args = args
       try:
           self.cluster = self.__connect_db()
           self.bucket = self.cluster.bucket("Kloia")
           self.collection = self.bucket.default_collection()
       except Exception as exp:
           logging.error(exp)

   def __get_authenticator(self):
       if self.args["user_name"] and self.args["password"]:
           return PasswordAuthenticator(self.args["user_name"], self.args["password"])
       return None

   def __get_conn_str(self):
       if self.args["cluster"]:
           return "couchbase://" + self.args["cluster"]
       return None

   def __connect_db(self):
       try:
           authenticator = self.__get_authenticator()
           conn_str = self.__get_conn_str()
           return Cluster(conn_str, authenticator=authenticator)
       except Exception as exp:
           logging.error(exp)
       return None

   def get(self, queryprep):
       try:
           res = self.cluster.query(queryprep)
           return res.rows()
       except Exception as exp:
           logging.error(exp)
           return []
The custom exporter is ready. I need to install it by using Ansible as a Systemd service.
Step 3 - Create service_check.ini
The config file is as follows. It includes the Prometheus client’s port number and some credentials for connecting to the Couchbase Server.
[couchbase]
port_number=
cluster=
user_name=
password=
Step 4 - Give variables from default vars and group vars.
I need to define Couchbase credentials to connect properly. These variables must be updated before running the playbook. Also, from default vars, I am declaring Prometheus Client’s port number.
ansible/group_vars/all.yaml ( We need to update )
couchbase_user_name: COUCHBASE_USER_NAME
couchbase_password: COUCHBASE_PASSWORD
ansible/couchbase_exporter/defaults/main.yaml
couchbase_exporter_path: /opt/couchbase-exporter
couchbase_exporter_port_number: 9900
couchbase_exporter_cluster: localhost
Step 5 - Create Systemd Service File
ansible/couchbase_exporter/templates/couchbase-exporter.service
[Unit]
Description=Metric Exporter Service
[Install]
WantedBy=multi-user.target
[Service]
User=monitoring
Group=monitoring
WorkingDirectory=
ExecStart=python3 "/exporter.py"
Restart=always
Step 6 - Create Ansible Handlers
After Tasks are done about the Systemd files, I need to reload the daemon. So, I need a handler for notifying Ansible. This will allow me to restart the Systemd Service.
ansible/couchbase_exporter/handlers/main.yaml
---
- name: "Restart couchbase-exporter"
  systemd:
    name: couchbase-exporter
    daemon_reload: true
    state: restarted
Step 7 - Create Ansible Tasks
Here are the tasks to install a custom exporter on a target as a Systemd Service.
ansible/couchbase_exporter/tasks/main.yaml
Monitoring user and group are created.
- name: Create monitoring user
  user:
    name: monitoring

- name: Create monitoring group
  group:
    name: monitoring
Exporter path with correct permissions and the correct user group is created.
- name: Create exporter directory
  file:
    state: directory
    owner: monitoring
    group: monitoring
    path: "/"
    mode: 0750
Custom Exporter Python Files are uploaded.
- name: Upload Exporter Lib Files
  copy:
    src: lib/
    dest: "/"
    mode: 0644
    directory_mode: "0755"
    owner: monitoring
    group: monitoring
Configuration File is uploaded.
- name: Upload Service_Check.ini File
  template:
    src: service_check.ini
    dest: "/"
    mode: u+rw,g-wx,o-rwx
    owner: monitoring
    group: monitoring
Systemd Service File is uploaded.
- name: Upload Exporter Systemd Files
  template:
    src: couchbase-exporter.service
    dest: /usr/lib/systemd/system/couchbase-exporter.service
    mode: 0644
    owner: monitoring
    group: monitoring
  notify: "Restart couchbase-exporter"
Systemd Service enabled.
- name: Enable Exporter Systemd
  systemd:
    name: couchbase-exporter
    daemon_reload: true
    state: started
    enabled: true
Service status is checked.
- name: Flush handlers
  meta: flush_handlers

- name: Get services status
  ansible.builtin.service_facts:

- name: Check if couchbase-exporter is running
  ansible.builtin.assert:
    quiet: true
    that: ansible_facts.services['couchbase-exporter.service']['state'] == 'running'
    fail_msg: couchbase-exporter.service is not running
Step 8 - Create a playbook and host.ini
I will create a playbook that is named application_exporters.yaml and update host.ini
ansible/application_exporters.yaml
- hosts: couchbase_exporter
  become: true
  roles:
  - couchbase_exporter
ansible/host.ini
[couchbase_exporter]
localhost
Step 9 - Run Ansible Playbook
Just run the playbook, then the custom exporter will be ready. It will yield metrics on the “9900” port.
ansible-playbook -i hosts.ini application_exporters.yaml
Step 10 (optional) - Add Exporter as a target to Prometheus
You can add exporter’s 9900 port to Prometheus as a target with the following snippet:
scrape_configs:- job_name: 'couchbase_exporter'metrics_path: /metricsscheme: httpstatic_configs:- targets:{ % for host in groups['couchbase_exporter'] % }- ":9900"{ % endfor % }relabel_configs:- source_labels: [__address__]regex: "([^:]+):.+"target_label: "instance"replacement: "$1"
After that, Prometheus will scrape this exporter’s metrics.
Conclusion
It is important to present the metrics and live with the data, make inferences from the data, and then make decisions accordingly. It is very easy to create a Prometheus target that collects our data with the kloia_exporter pip package.
Give kloia_exporter a try.

API Internship Experience: Lessons Learned During My Journey at Kloia
Managing Kubernetes Clusters with the GitOps

No Comments Yet
Let us know what you think