If you have events/messages that you want to store in elasticsearch, Kafka Connect is the way to go. It allows you to store the Kafka messages in elasticsearch with the help of elasticsearch sink connector using custom configurations. There is not much documentation available online but don’t worry, I will walk you through how you can publish messages to a specific kafka topic and have them stored in elasticsearch easily.

Requirements
You need to have the following installed:
I will run kafka, zookeeper, kafka-connect and elasticsearch using docker. If you haven’t changed your docker configuration before, I would recommend you to increase your memory to 6-8GB just to be safe.
Get started
Change /etc/hosts file for kafka
Since in docker-compose.yml file KAFKA_ADVERTISED_HOST_NAME is set to “kafka”, I need to do a small change in /etc/hosts file
version: '2'
services:
  zookeeper:
    container_name: zookeeper
    image: wurstmeister/zookeeper
    ports:
      - 2181:2181
      - 2888:2888
      - 3888:3888

  kafka:
    image: wurstmeister/kafka:2.12-2.5.1
    container_name: kafka
    depends_on:
      - zookeeper
    ports:
      - "9092:9092"
    environment:
      KAFKA_ZOOKEEPER_CONNECT: zookeeper:2181
      KAFKA_BROKER_ID: "42"
      KAFKA_ADVERTISED_HOST_NAME: "kafka"
      KAFKA_ADVERTISED_LISTENERS: PLAINTEXT://kafka:9092

  elasticsearch:
    container_name: elastic
    image: docker.elastic.co/elasticsearch/elasticsearch:7.10.2
    ports:
      - "9200:9200"
      - "9300:9300"
    environment:
      - xpack.security.enabled=false
      - discovery.type=single-node
      - bootstrap.memory_lock=true
      - "ES_JAVA_OPTS=-Xms512m -Xmx512m"
      - cluster.routing.allocation.disk.threshold_enabled=false
    ulimits:
      memlock:
        soft: -1
        hard: -1

  connect:
    container_name: kafka-connect
    image: confluentinc/cp-kafka-connect:3.3.1
    ports:
      - "8083:8083"
    depends_on:
      - zookeeper
      - kafka
    volumes:
      - $PWD/connect-plugins:/connect-plugins
    environment:
      CONNECT_BOOTSTRAP_SERVERS: kafka:9092
      CONNECT_REST_PORT: 8083
      CONNECT_GROUP_ID: "connect"
      CONNECT_CONFIG_STORAGE_TOPIC: connect-config
      CONNECT_OFFSET_STORAGE_TOPIC: connect-offsets
      CONNECT_STATUS_STORAGE_TOPIC: connect-status
      CONNECT_REPLICATION_FACTOR: 1
      CONNECT_CONFIG_STORAGE_REPLICATION_FACTOR: 1
      CONNECT_OFFSET_STORAGE_REPLICATION_FACTOR: 1
      CONNECT_STATUS_STORAGE_REPLICATION_FACTOR: 1
      CONNECT_KEY_CONVERTER: "org.apache.kafka.connect.json.JsonConverter"
      CONNECT_KEY_CONVERTER_SCHEMAS_ENABLE: "false"
      CONNECT_VALUE_CONVERTER: "org.apache.kafka.connect.json.JsonConverter"
      CONNECT_VALUE_CONVERTER_SCHEMAS_ENABLE: "false"
      CONNECT_INTERNAL_KEY_CONVERTER: "org.apache.kafka.connect.json.JsonConverter"
      CONNECT_INTERNAL_VALUE_CONVERTER: "org.apache.kafka.connect.json.JsonConverter"
      CONNECT_PRODUCER_INTERCEPTOR_CLASSES: "io.confluent.monitoring.clients.interceptor.MonitoringProducerInterceptor"
      CONNECT_CONSUMER_INTERCEPTOR_CLASSES: "io.confluent.monitoring.clients.interceptor.MonitoringConsumerInterceptor"
      CONNECT_REST_ADVERTISED_HOST_NAME: "connect"
      CONNECT_ZOOKEEPER_CONNECT: zookeeper:2181
      CONNECT_PLUGIN_PATH: /connect-plugins
      CONNECT_LOG4J_ROOT_LOGLEVEL: INFO
      CONNECT_LOG4J_LOGGERS: org.reflections=ERROR
      CLASSPATH: /usr/share/java/monitoring-interceptors/monitoring-interceptors-3.3.0.jar
After I got my docker-compose ready,
docker-compose up -d
docker ps
You should see that containers are up and running:
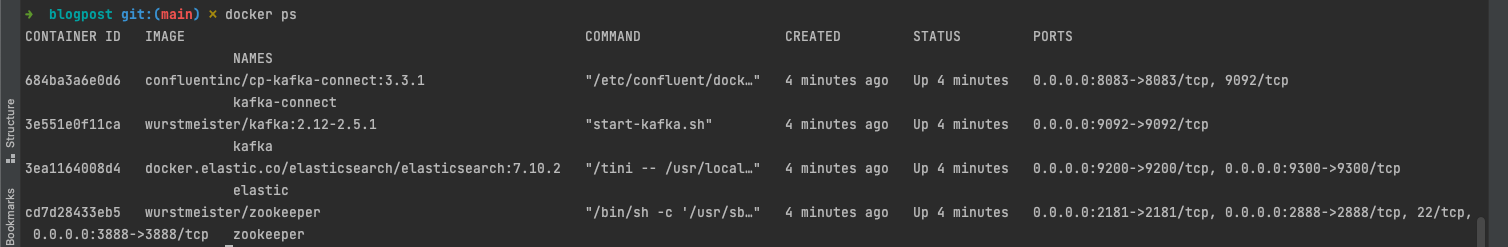
- http://localhost:9200/ - Elasticsearch
- http://localhost:8083/ - Kafka Connect
Configure Kafka Connect
After you have given it some time to stabilize and waited a little, you should send the following request:
POST http://localhost:8083/connectors
Content-Type: application/json
{
  "name": "elasticsearch-sink",
  "config": {
    "connector.class": "io.confluent.connect.elasticsearch.ElasticsearchSinkConnector",
    "tasks.max": "1",
    "topics": "example-topic",
    "key.ignore": "true",
    "schema.ignore": "true",
    "connection.url": "http://localhost:9200",
    "type.name": "_doc",
    "name": "elasticsearch-sink",
    "key.converter": "org.apache.kafka.connect.json.JsonConverter",
    "key.converter.schemas.enable": "false",
    "value.converter": "org.apache.kafka.connect.json.JsonConverter",
    "value.converter.schemas.enable": "false",
    "transforms": "insertTS,formatTS",
    "transforms.insertTS.type": "org.apache.kafka.connect.transforms.InsertField\$Value",
    "transforms.insertTS.timestamp.field": "messageTS",
    "transforms.formatTS.type": "org.apache.kafka.connect.transforms.TimestampConverter\$Value",
    "transforms.formatTS.format": "yyyy-MM-dd'T'HH:mm:ss",
    "transforms.formatTS.field": "messageTS",
    "transforms.formatTS.target.type": "string"
  }
}
Go to http://localhost:8083/connectors to make sure your connector is created.
Things to note:
- "topics": "example-topic" → Your index name for elasticsearch
- "connection.url": "http://localhost:9200" → Your Elasticsearch URL
- "value.converter": "org.apache.kafka.connect.json.JsonConverter" → The type of the value
- "transforms.formatTS.field": "messageTS" → This is the formatted timestamp. Grafana requires "yyyy-MM-dd'T'HH:mm:ss" format. All the fields that start with “transforms” are there to convert the timestamp.
Messages stored in Elasticsearch
After you have sent you post request, simply run:
docker exec -i kafka bash -c "echo '{\"request\": {\"userId\" : \"23768432478278\"}}' | /opt/kafka/bin/kafka-console-producer.sh --broker-list kafka:9092 --topic example-topic"
This will publish a dummy message to kafka.
I should be able to see this message on elasticsearch with the help of Kafka Connect. Let’s check if we successfully sent a kafka message and stored it in elasticsearch.
Go to http://localhost:9200/example-topic/_search?pretty
You should see the following return:
  {
  "took" : 256,
  "timed_out" : false,
  "_shards" : {
    "total" : 1,
    "successful" : 1,
    "skipped" : 0,
    "failed" : 0
  },
  "hits" : {
    "total" : {
      "value" : 3,
      "relation" : "eq"
    },
    "max_score" : 1.0,
    "hits" : [
      {
        "_index" : "example-topic",
        "_type" : "_doc",
        "_id" : "example-topic+0+0",
        "_score" : 1.0,
        "_source" : {
          "request" : {
            "userId" : "23768432478278"
          },
          "messageTS" : "2022-04-13T20:42:05"
        }
      },
      {
        "_index" : "example-topic",
        "_type" : "_doc",
        "_id" : "example-topic+0+1",
        "_score" : 1.0,
        "_source" : {
          "request" : {
            "userId" : "23768432432453"
          },
          "messageTS" : "2022-04-13T20:42:14"
        }
      },
      {
        "_index" : "example-topic",
        "_type" : "_doc",
        "_id" : "example-topic+0+2",
        "_score" : 1.0,
        "_source" : {
          "request" : {
            "userId" : "23768432432237"
          },
          "messageTS" : "2022-04-13T20:42:23"
        }
      }
    ]
  }
}
Bash script to perform all the operations mentioned above
You can also use my docker-compose file and simply run startup.sh to avoid all the blood and tears.
git clone https://github.com/barangayretli/kafka-connect-sink-connector.git
/bin/bash startup.sh
Hooray, that’s it!
Go to my Github repository to check out the source code!
Possible Errors
Note: If you ever face the flush timeout error while you are trying to process a massive amount of data, just increase flush.timeout.ms field. It is 5 seconds by default.
[2022-05-13 21:38:04,987] ERROR WorkerSinkTask{id=log-platform-elastic-0} Commit of offsets threw an unexpected exception for sequence number 14: null (org.apache.kafka.connect.runtime.WorkerSinkTask:233) org.apache.kafka.connect.errors.ConnectException: Flush timeout expired with unflushed records: 15805
e.g “flush.timeout.ms”: 100000
This will allow kafka connect enough time to send the data to elasticsearch without having timeout errors.
Bonus
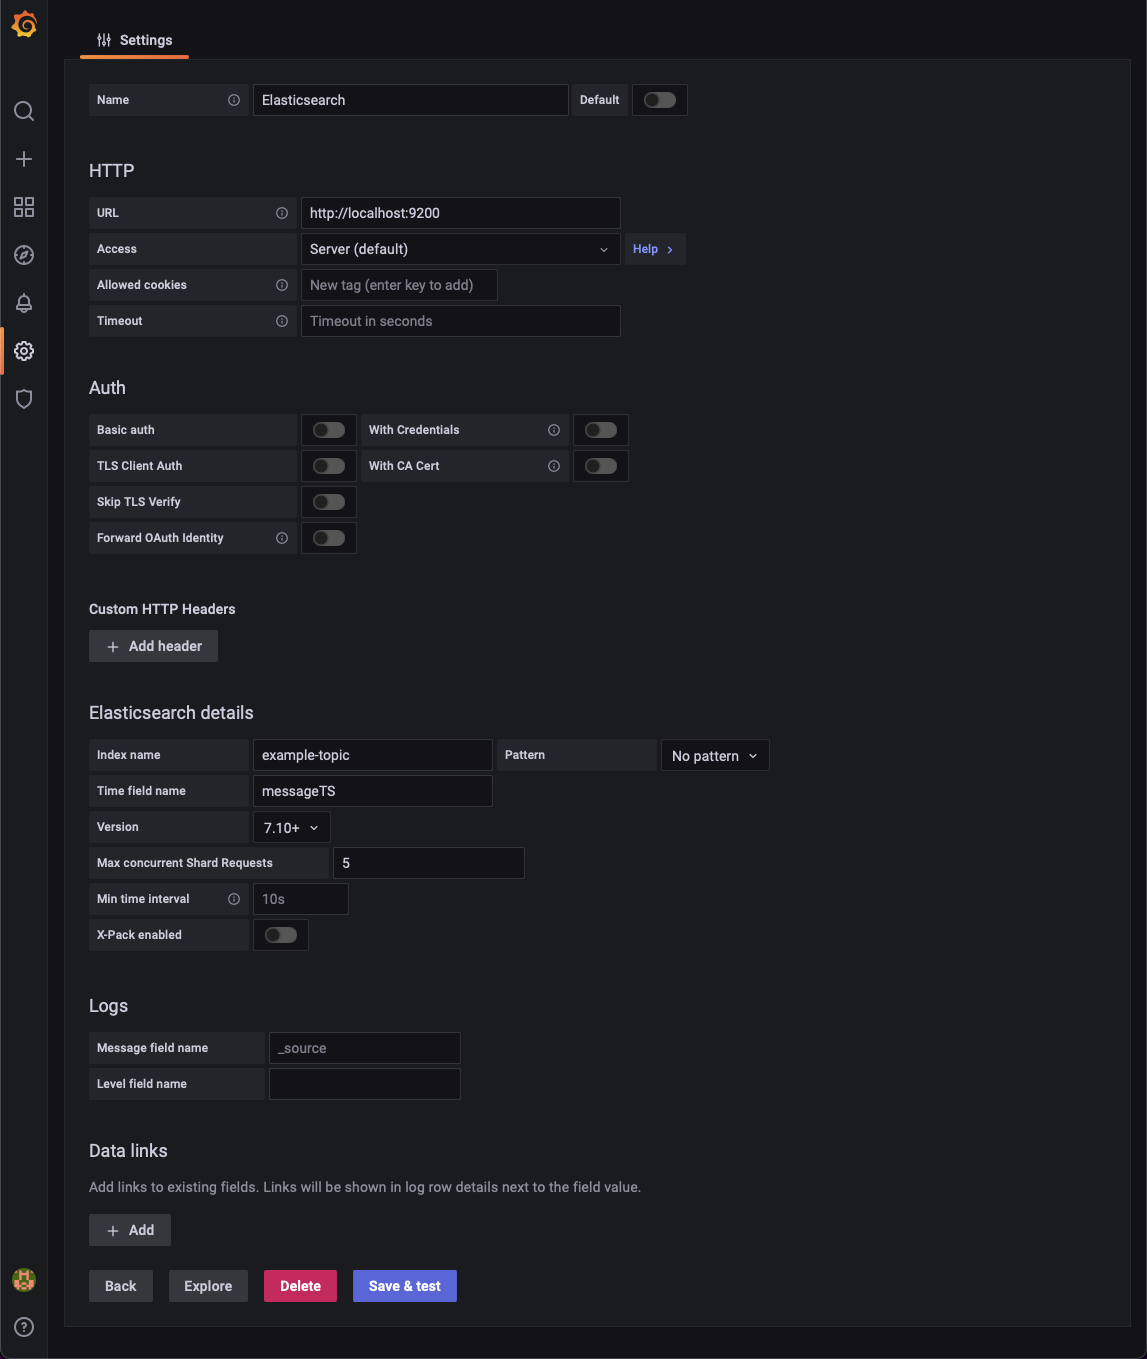
This part is optional. If you have completed the steps above, now you are ready to visualize the messages with Grafana by adding Elasticsearch as the datasource! Go to Configuration→Data Sources→Add Data Source→Select Elasticsearch and fill out the settings as the following. You need to keep in mind that your kafka topic name corresponds to the index name in elasticsearch. After filling the required fields, now you are ready to see your Elasticsearch logs on Grafana!