Application Performance Monitoring (APM ) empowers companies to monitor the performance and availability metrics of their business-critical applications, receive alerts immediately in case of performance issues /erroneous rising, and generate reports for periodic performance analysis.
According to the Gartner report on APMs, every APM should have five main dimensions to meet the common expectations from customers :
- End-user experience monitoring
- Application runtime architecture discovery and modelling
- User-defined transaction profiling
- Application component monitoring
- Reporting & Application of data analytics
These are the baseline expectations from any successful APM usage. However, nowadays, the containerized world is forcing people to see the whole picture regarding control and visibility of the infrastructure. This is a new requirement and it implies new capabilities from APMs, such as monitoring the following:
- Kubernetes Integration & Cluster status
- Deployment and Manifest Details
- Analytics and Tracing
- Pipeline Feedbacks from APM
Kubernetes Perspective of Instana
Kubernetes Cluster Overview
With Instana, you can see all the details of your kubernetes clusters . This ability is critical for identifying root causes, fitting the best practices, seeing what’s left on VMs / Bare Metal in terms of CPU and Memory reservation.The following items are the most useful things you can glean from Instana regarding kubernetes.
- Total Memory/CPU Limits & Requests
- Total Pod Number and Allocation and their distribution to namespaces and nodes
- Kubernetes Components Status (Etcd, controller manager, scheduler, etc.)
- Cluster Events
- Nodes Healths
Bottom Up Pod Trace in Kubernetes Cluster
As you can see on the screenshot above, you can easily trace from a pod to the node with a bottom up approach with showing pod dependencies like:
- The node and the namespace that the pod belongs to
- Services that are created with tracked pod
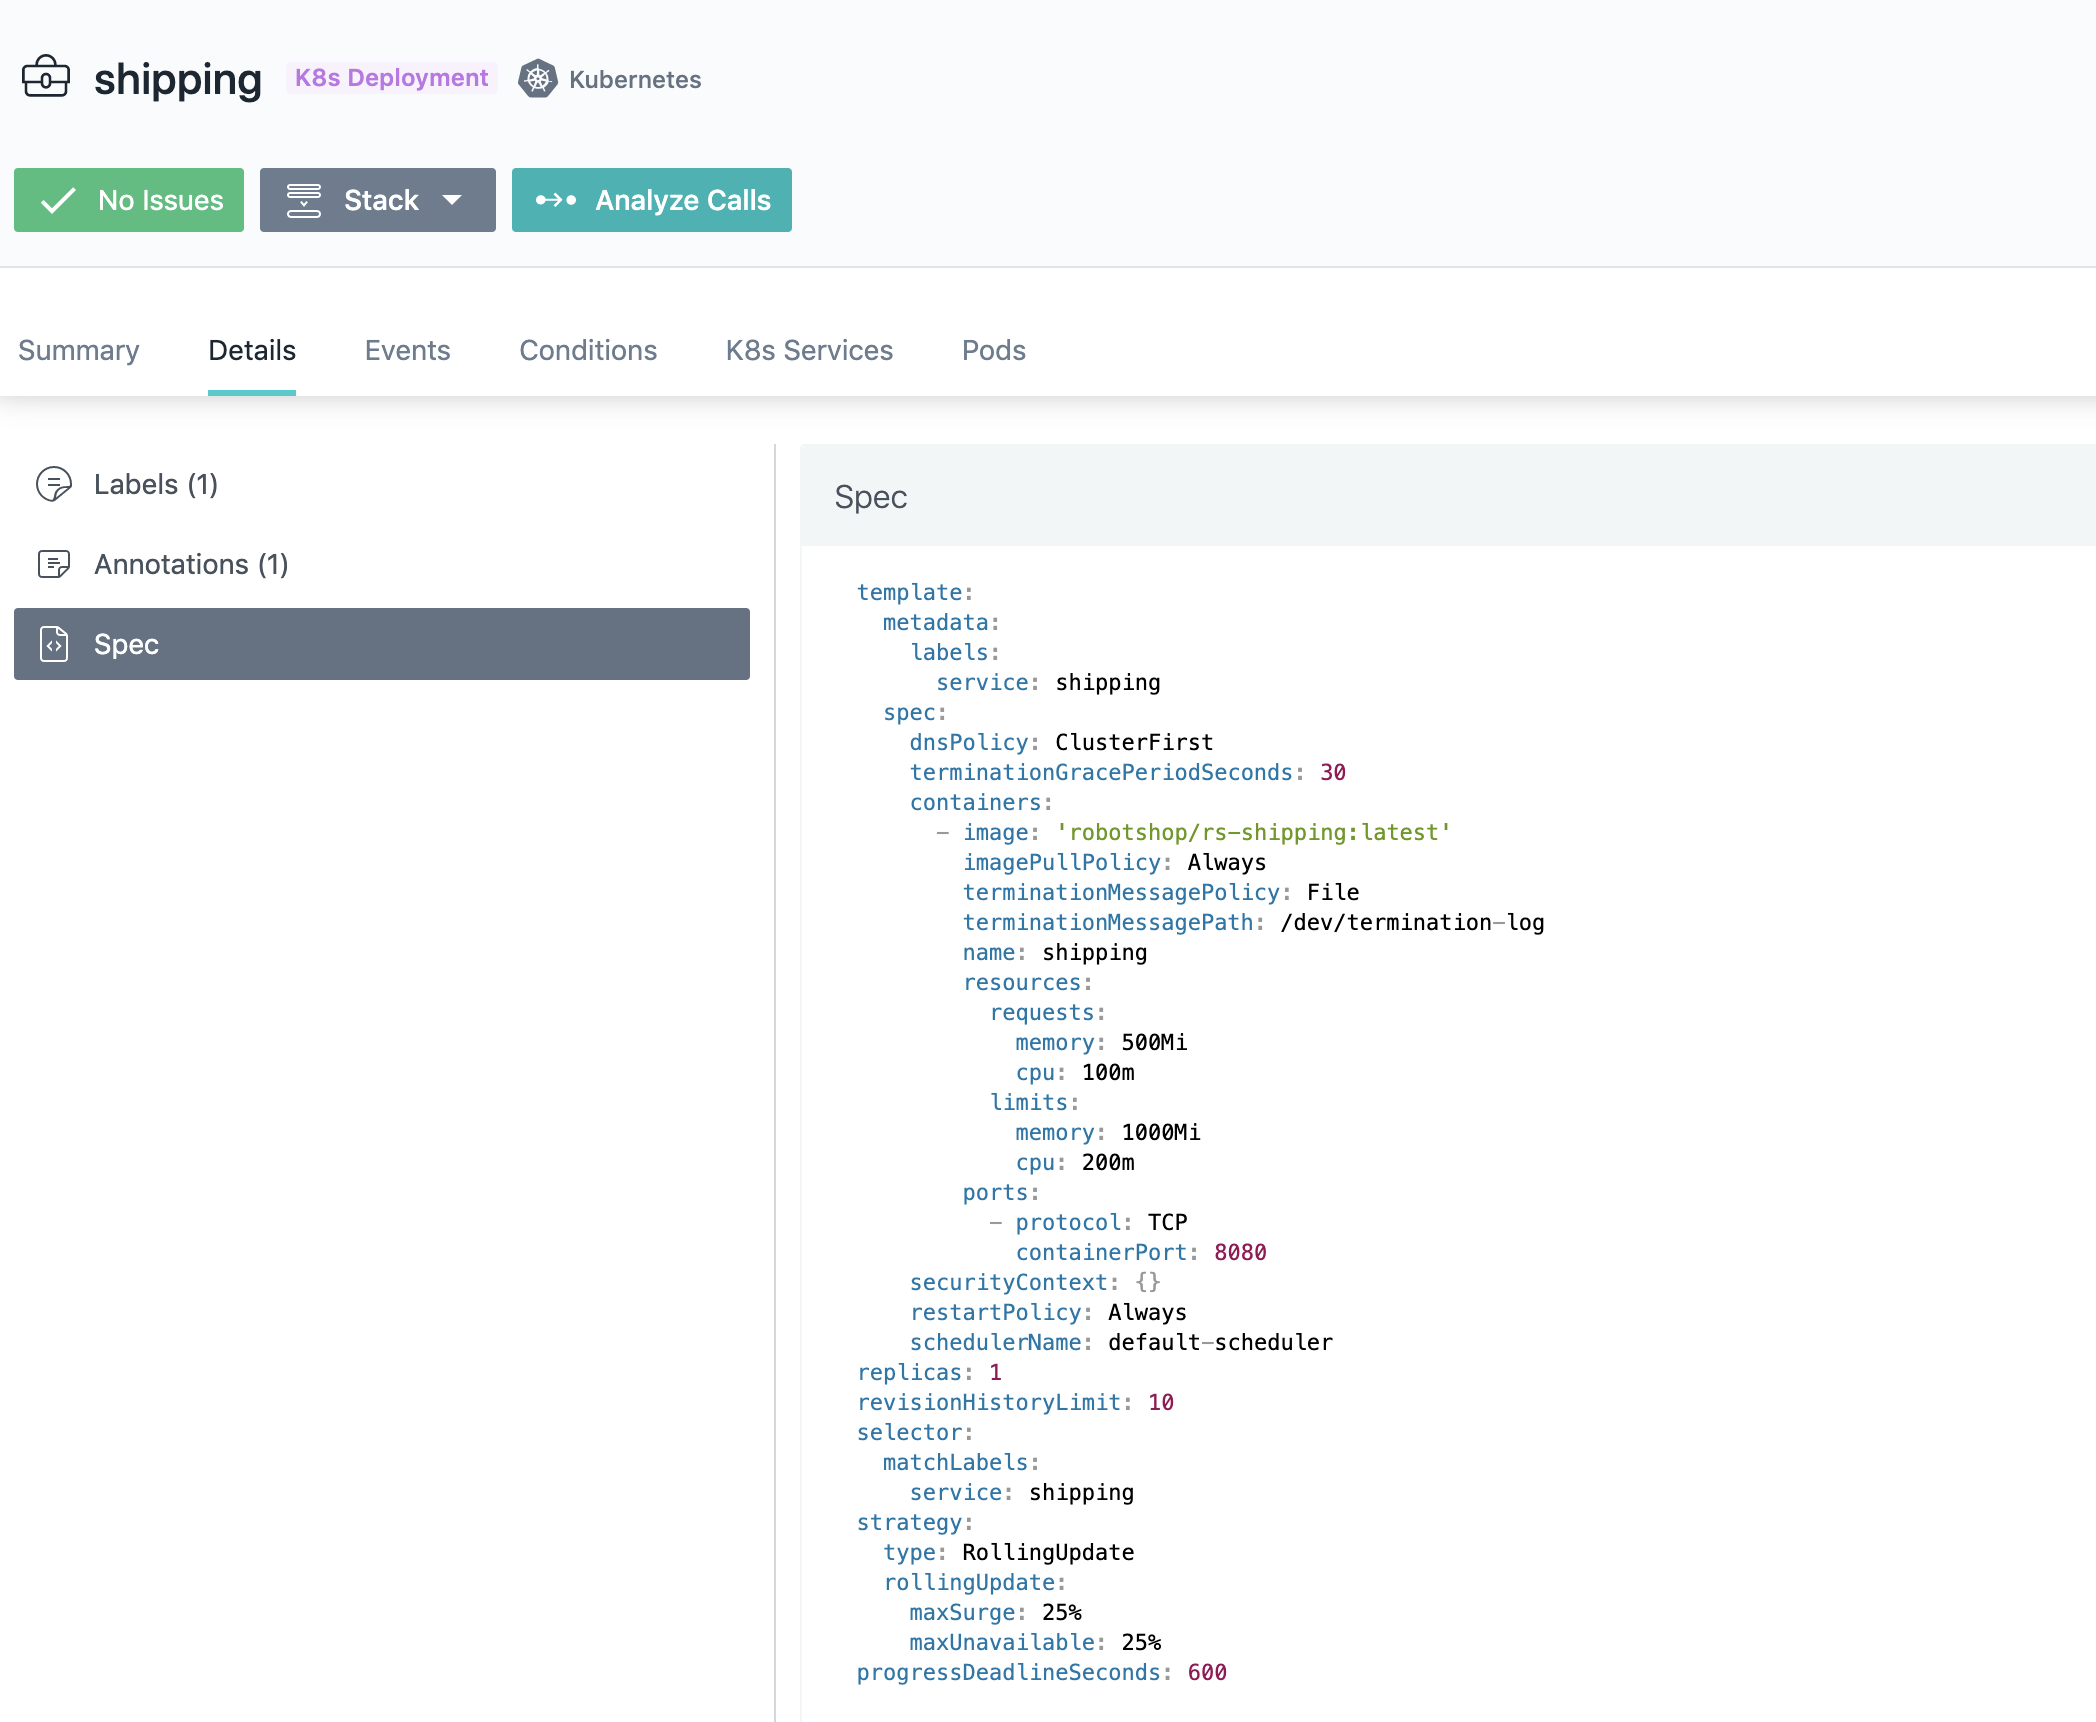
Detailed Deployment Manifests on Instana
Instana provides a complete deployment manifest on the Kubernetes cluster, and this enables you to check the current status of the deployment and its configuration. You don’t need to connect your kubernetes cluster and run some kubectl command!
MicroService Communication / Dependency on each other
Service Dependency on Specific Application Perspective
Before getting into the details on service dependency, I should mention the application perspective that enables people to focus only on what they want to see on any APM dashboard. With the Application perspective, you can group your services to specific subsets according to the namespaces, HTTP status call response, container labels, JVM versions, runtime and many more items!
Let’s say you have created a view within a logical group for your services, and you want to see the dependencies between them on your coherent subset (Application Perspective). With Instana’s dependency graph, you can hover/underline and double size your services according to some predefined capabilities which are :
- Max Latency
- Max Erroneous Call Rate
- Incoming Calls
For better understanding and, you can play with the view according to the Upstream/ Downstream calls to/from your services.
Analytics and Tracing
First of all, we need to identify two terms calls and traces :
A call models conversation between two services.It is constructed of descriptive caller and callee information containing endpoints, type-specific payloads ,parameters, exceptions, and specifics.
&
A trace is the snapshot of one request and its journey through a service structure.This might be the direct consequence of a request initiated by the client of a consumer, which might also be triggered by a planned job or some other internal execution. A specific trace may consist of several calls.
Trace Analytics on Instana
For the traces on Instana, you can filter your calls by :
- Application and Service Name
- Specific Endpoint
- Service Type (HTTP, database, messaging, etc.)
- Technology (Java,NodeJS,.net etc.)
- Latency Spectrum
- Erroneous or not
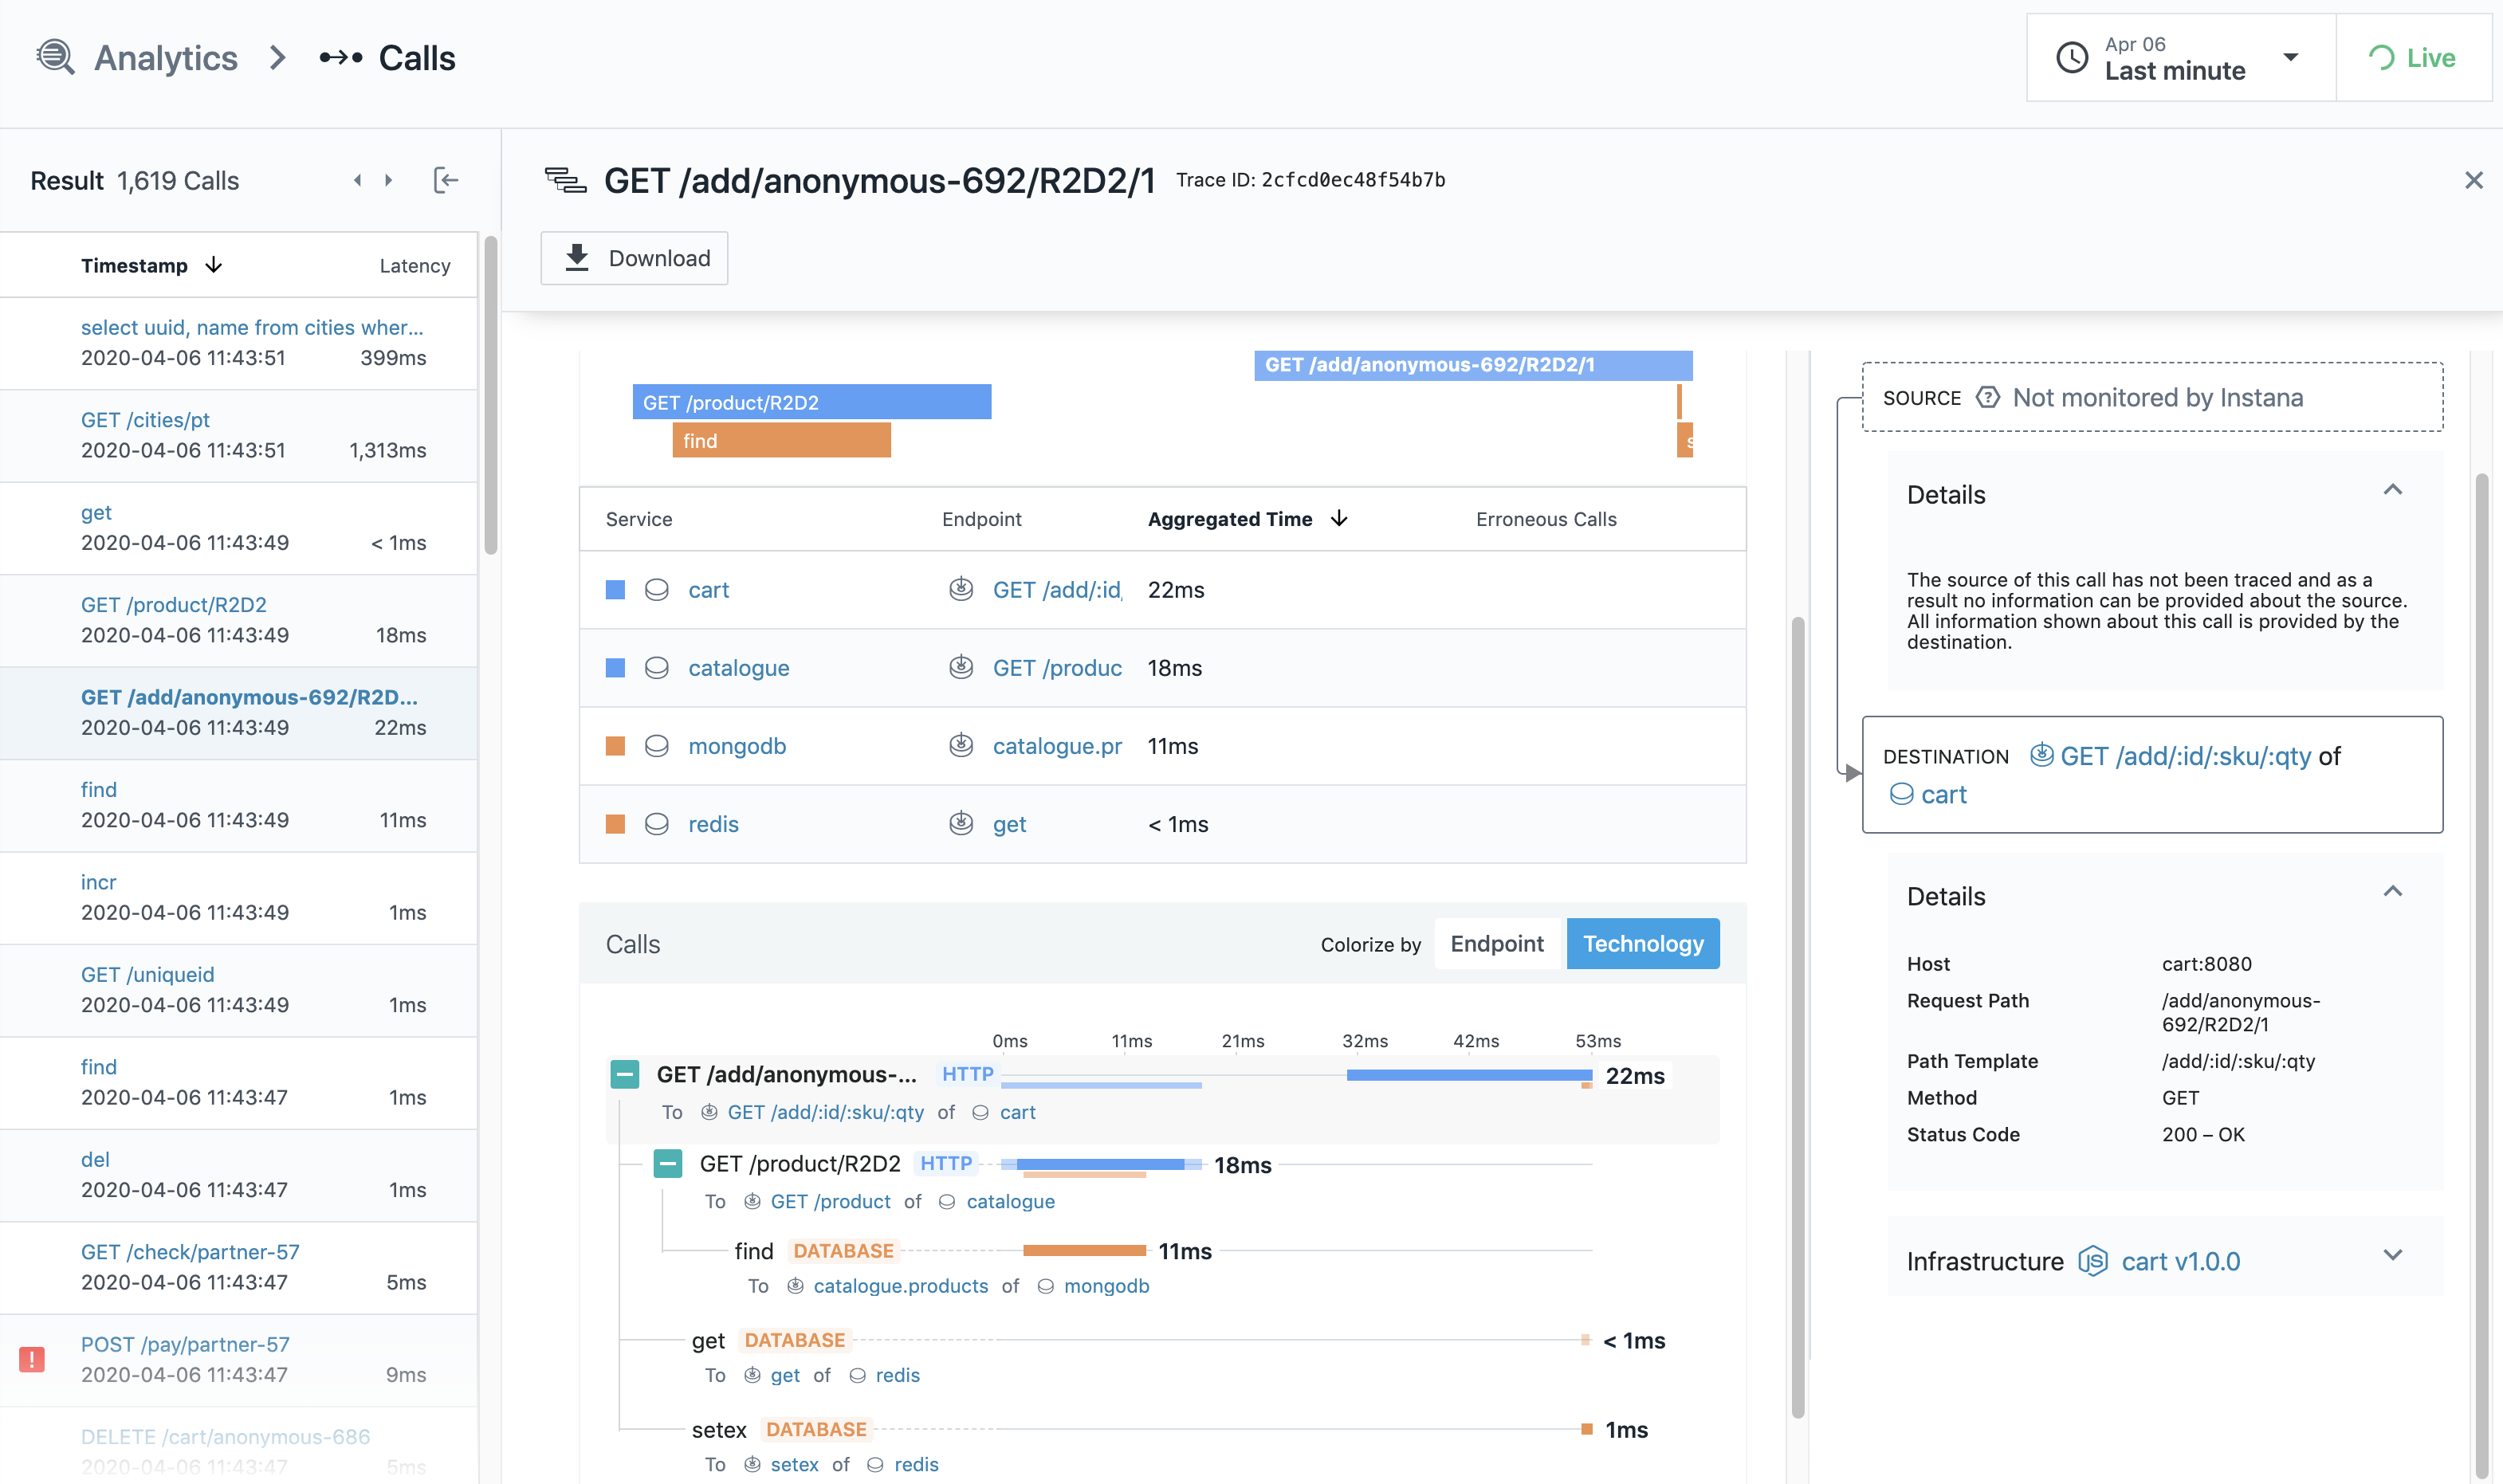
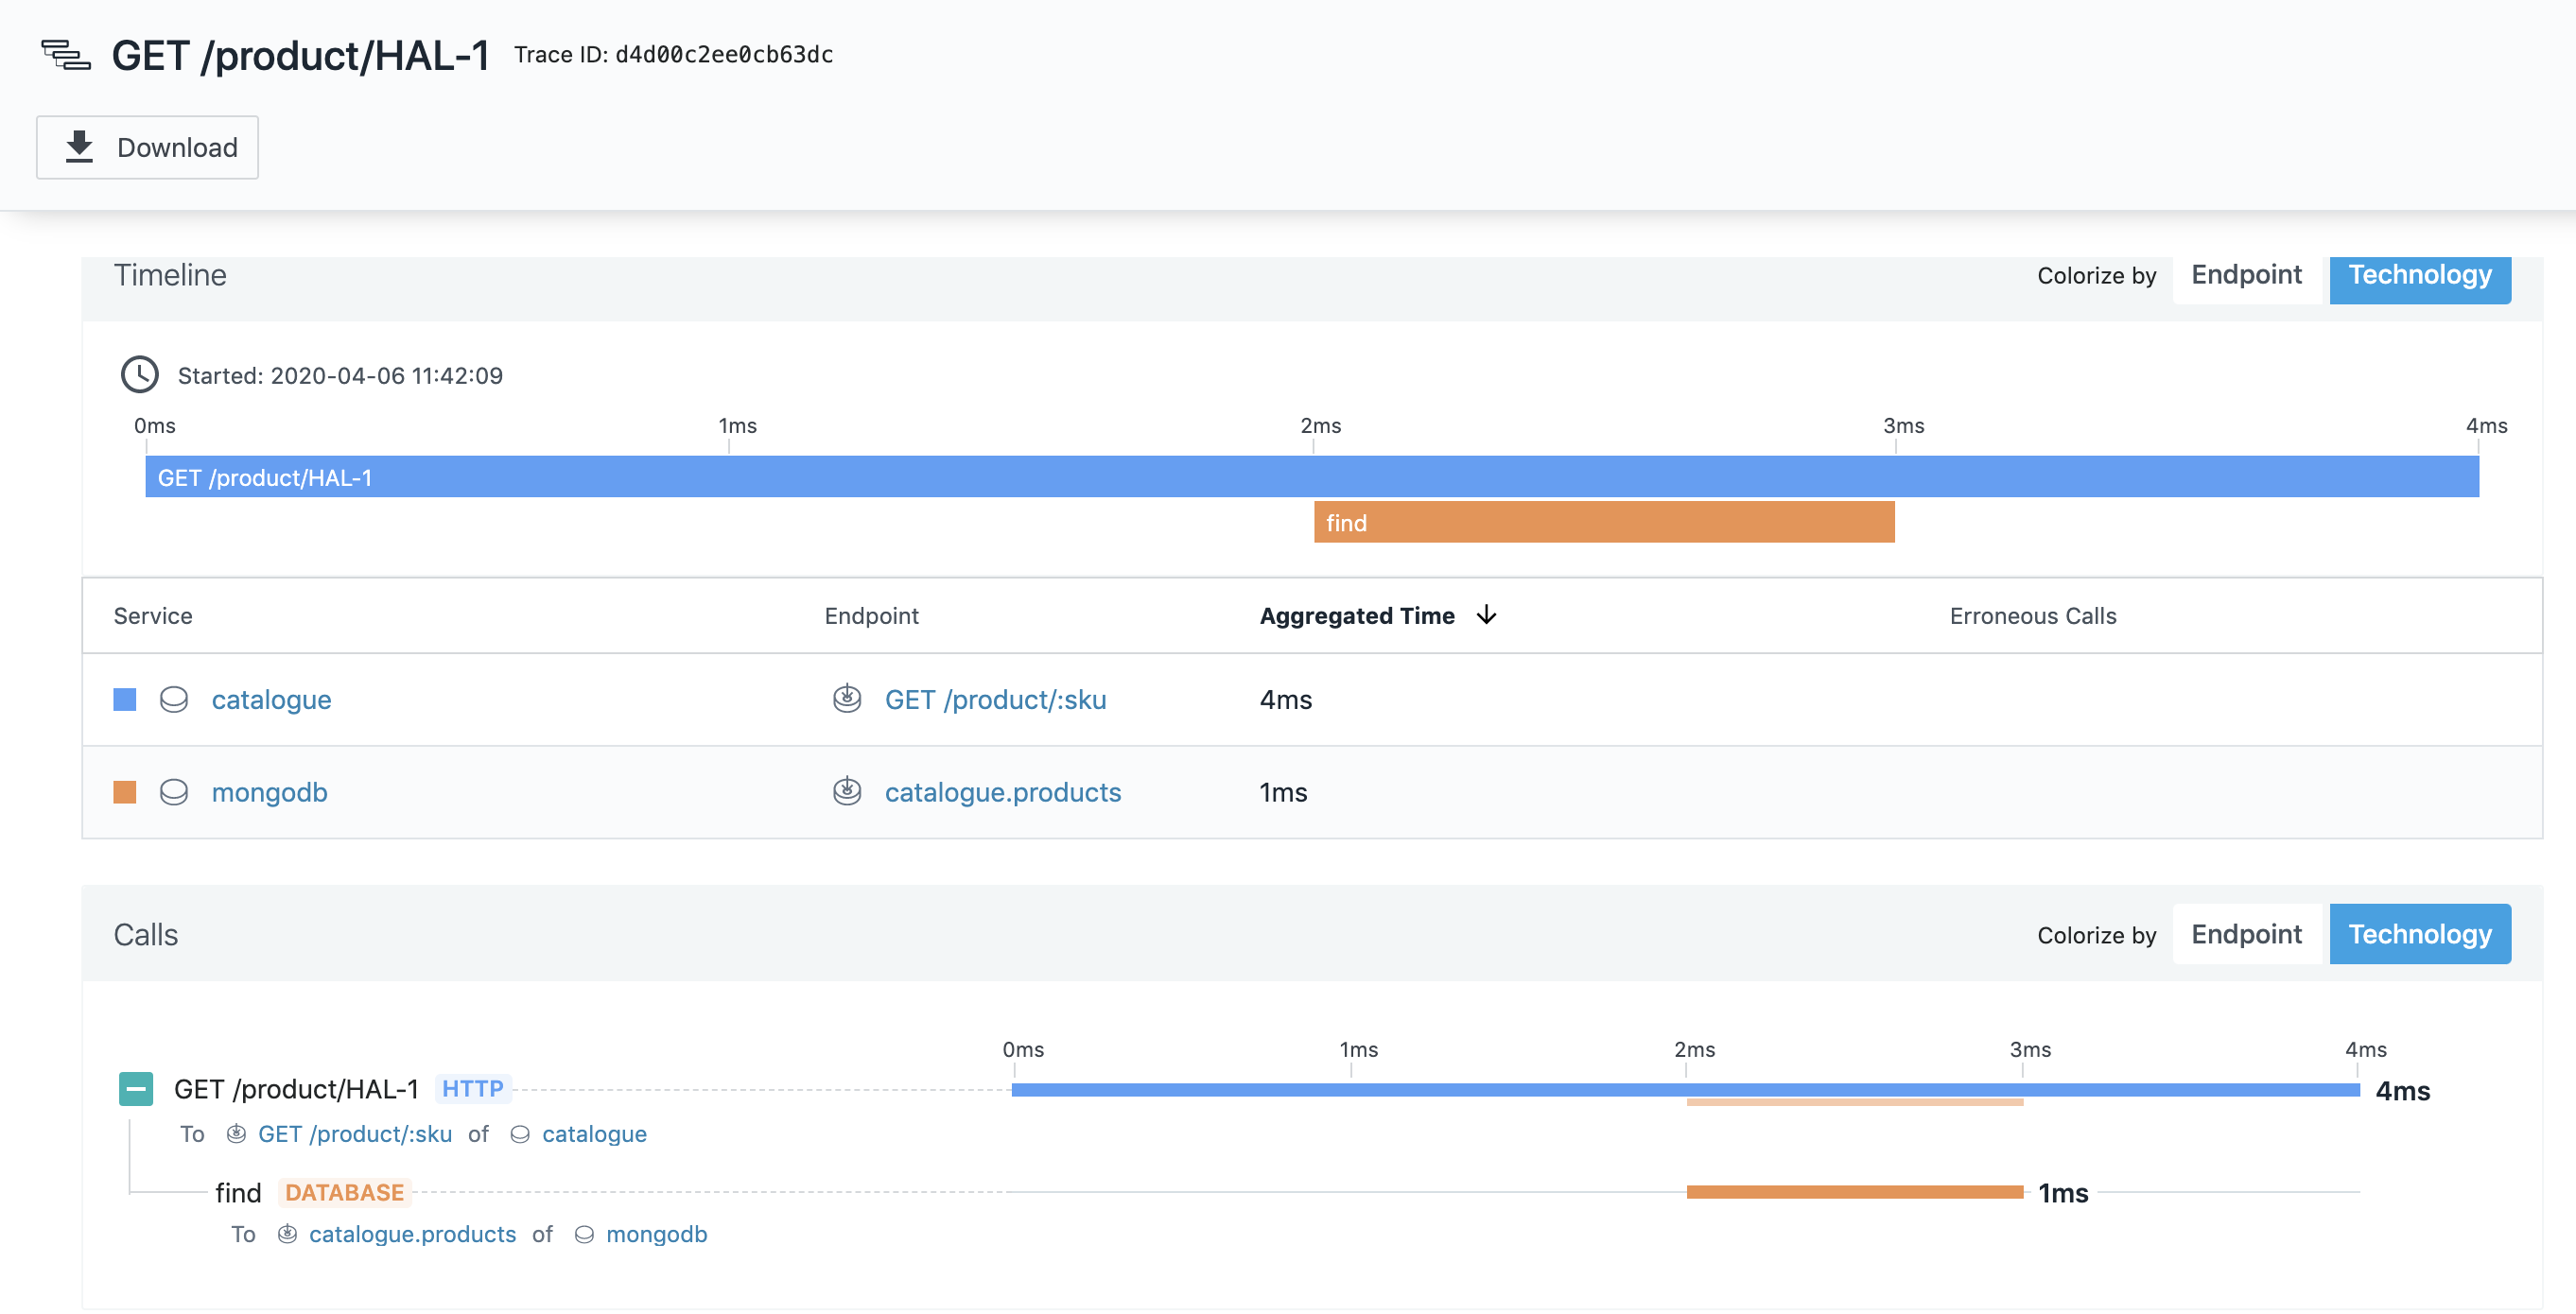
Call Analytics and related stack traces on Instana
In the call analytics screen on Instana, you will see the details about stack trace and any exceptions of the calls being traced. Moreover, time spent on services or databases relate with the request, callee details regarding service/pod/application and its position on your infrastructure, etc. These items provided by Instana analytics make developer’ s/SRE’s life easier on Root Cause Analysis.
Instana AutoProfiling in Java
Profiles are essential for discovering execution problem areas and bottlenecks at the code level. It’s the first step in gaining better performance with less compute resource usage.
AutoProfile™ , a feature of Instana, continuously checks available profiles to report to Instana, unlike other APMs where a client should physically start profiling. AutoProfile™ consequently plans and persistently performs profiling of your crucial environments for providing better RCA (Root Cause Analysis).
And now AutoProfile™ is currently on beta for Java and here is the way that you can enable this feature :
During the technical beta phase, the profiling feature is disabled by default. To enable profiling, edit the agent configuration file
<agent_install_dir>/etc/instana/configuration.yaml

com.instana.plugin.profiling.java:

 enabled: true
As you can see below, you can see all the methods with their wait time within an auto-generated profile. Furthermore, if you click any of the methods, you will see the actual code with its line numbers on a new window. Thanks to that, identifying places that causes latency in the code will be as easy as pie!
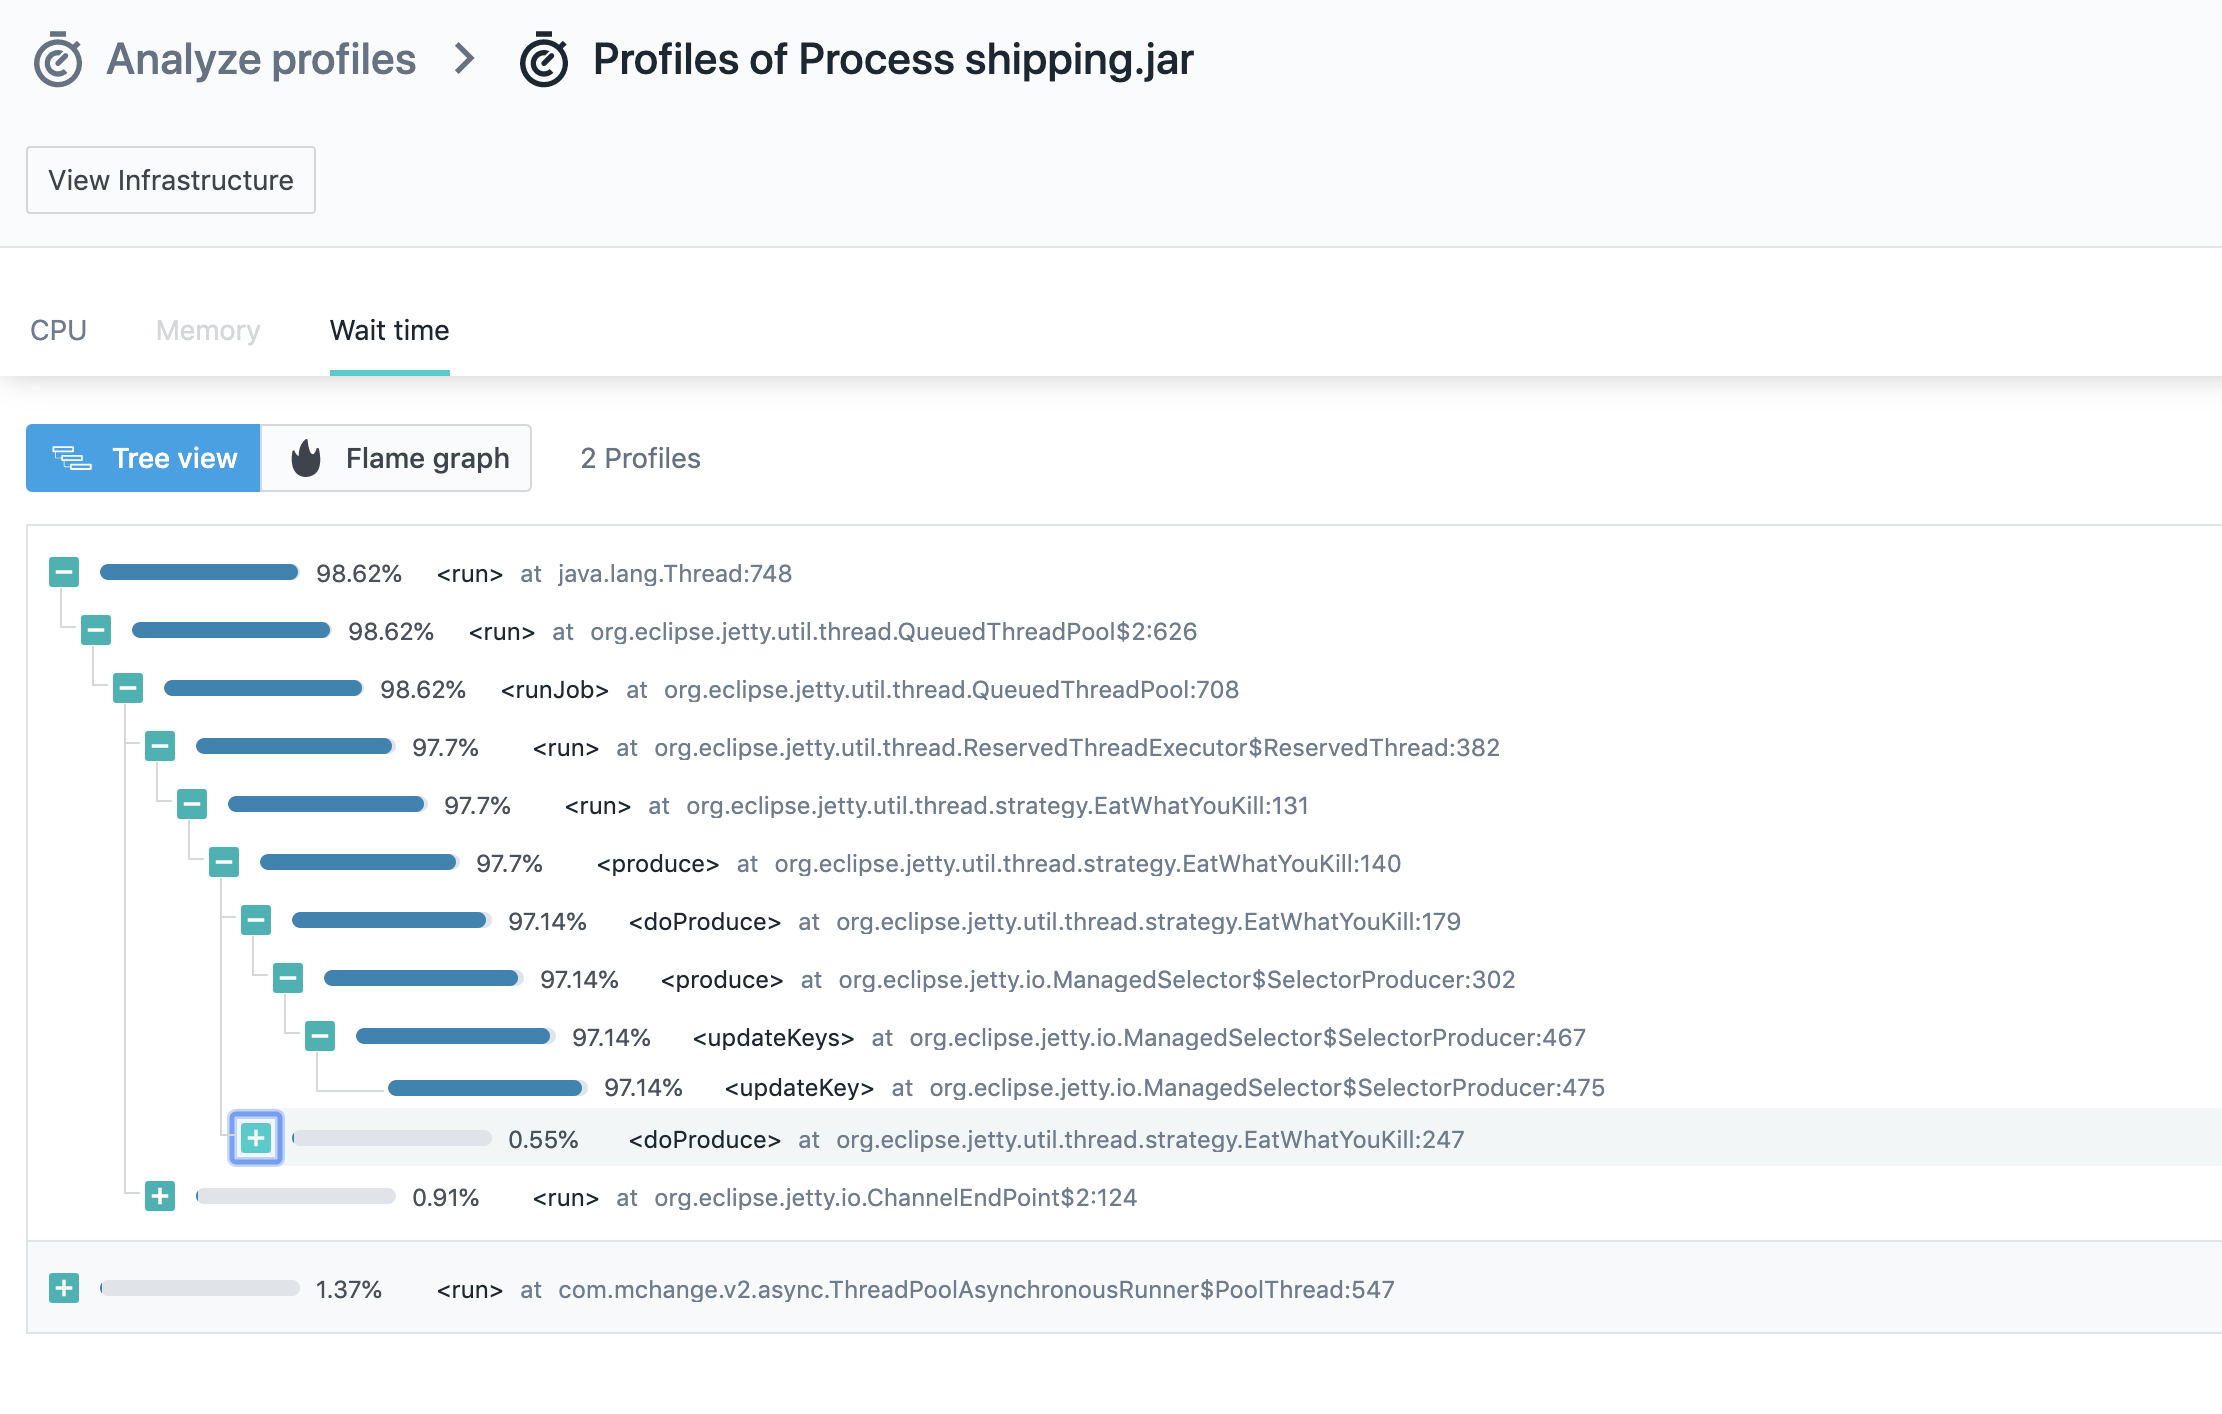
Java Wait Time Tree View for Specific Profile
Besides the wait times on Instana, you will see a Flame Graph regarding the CPU usage and hot spots separated at the method level!
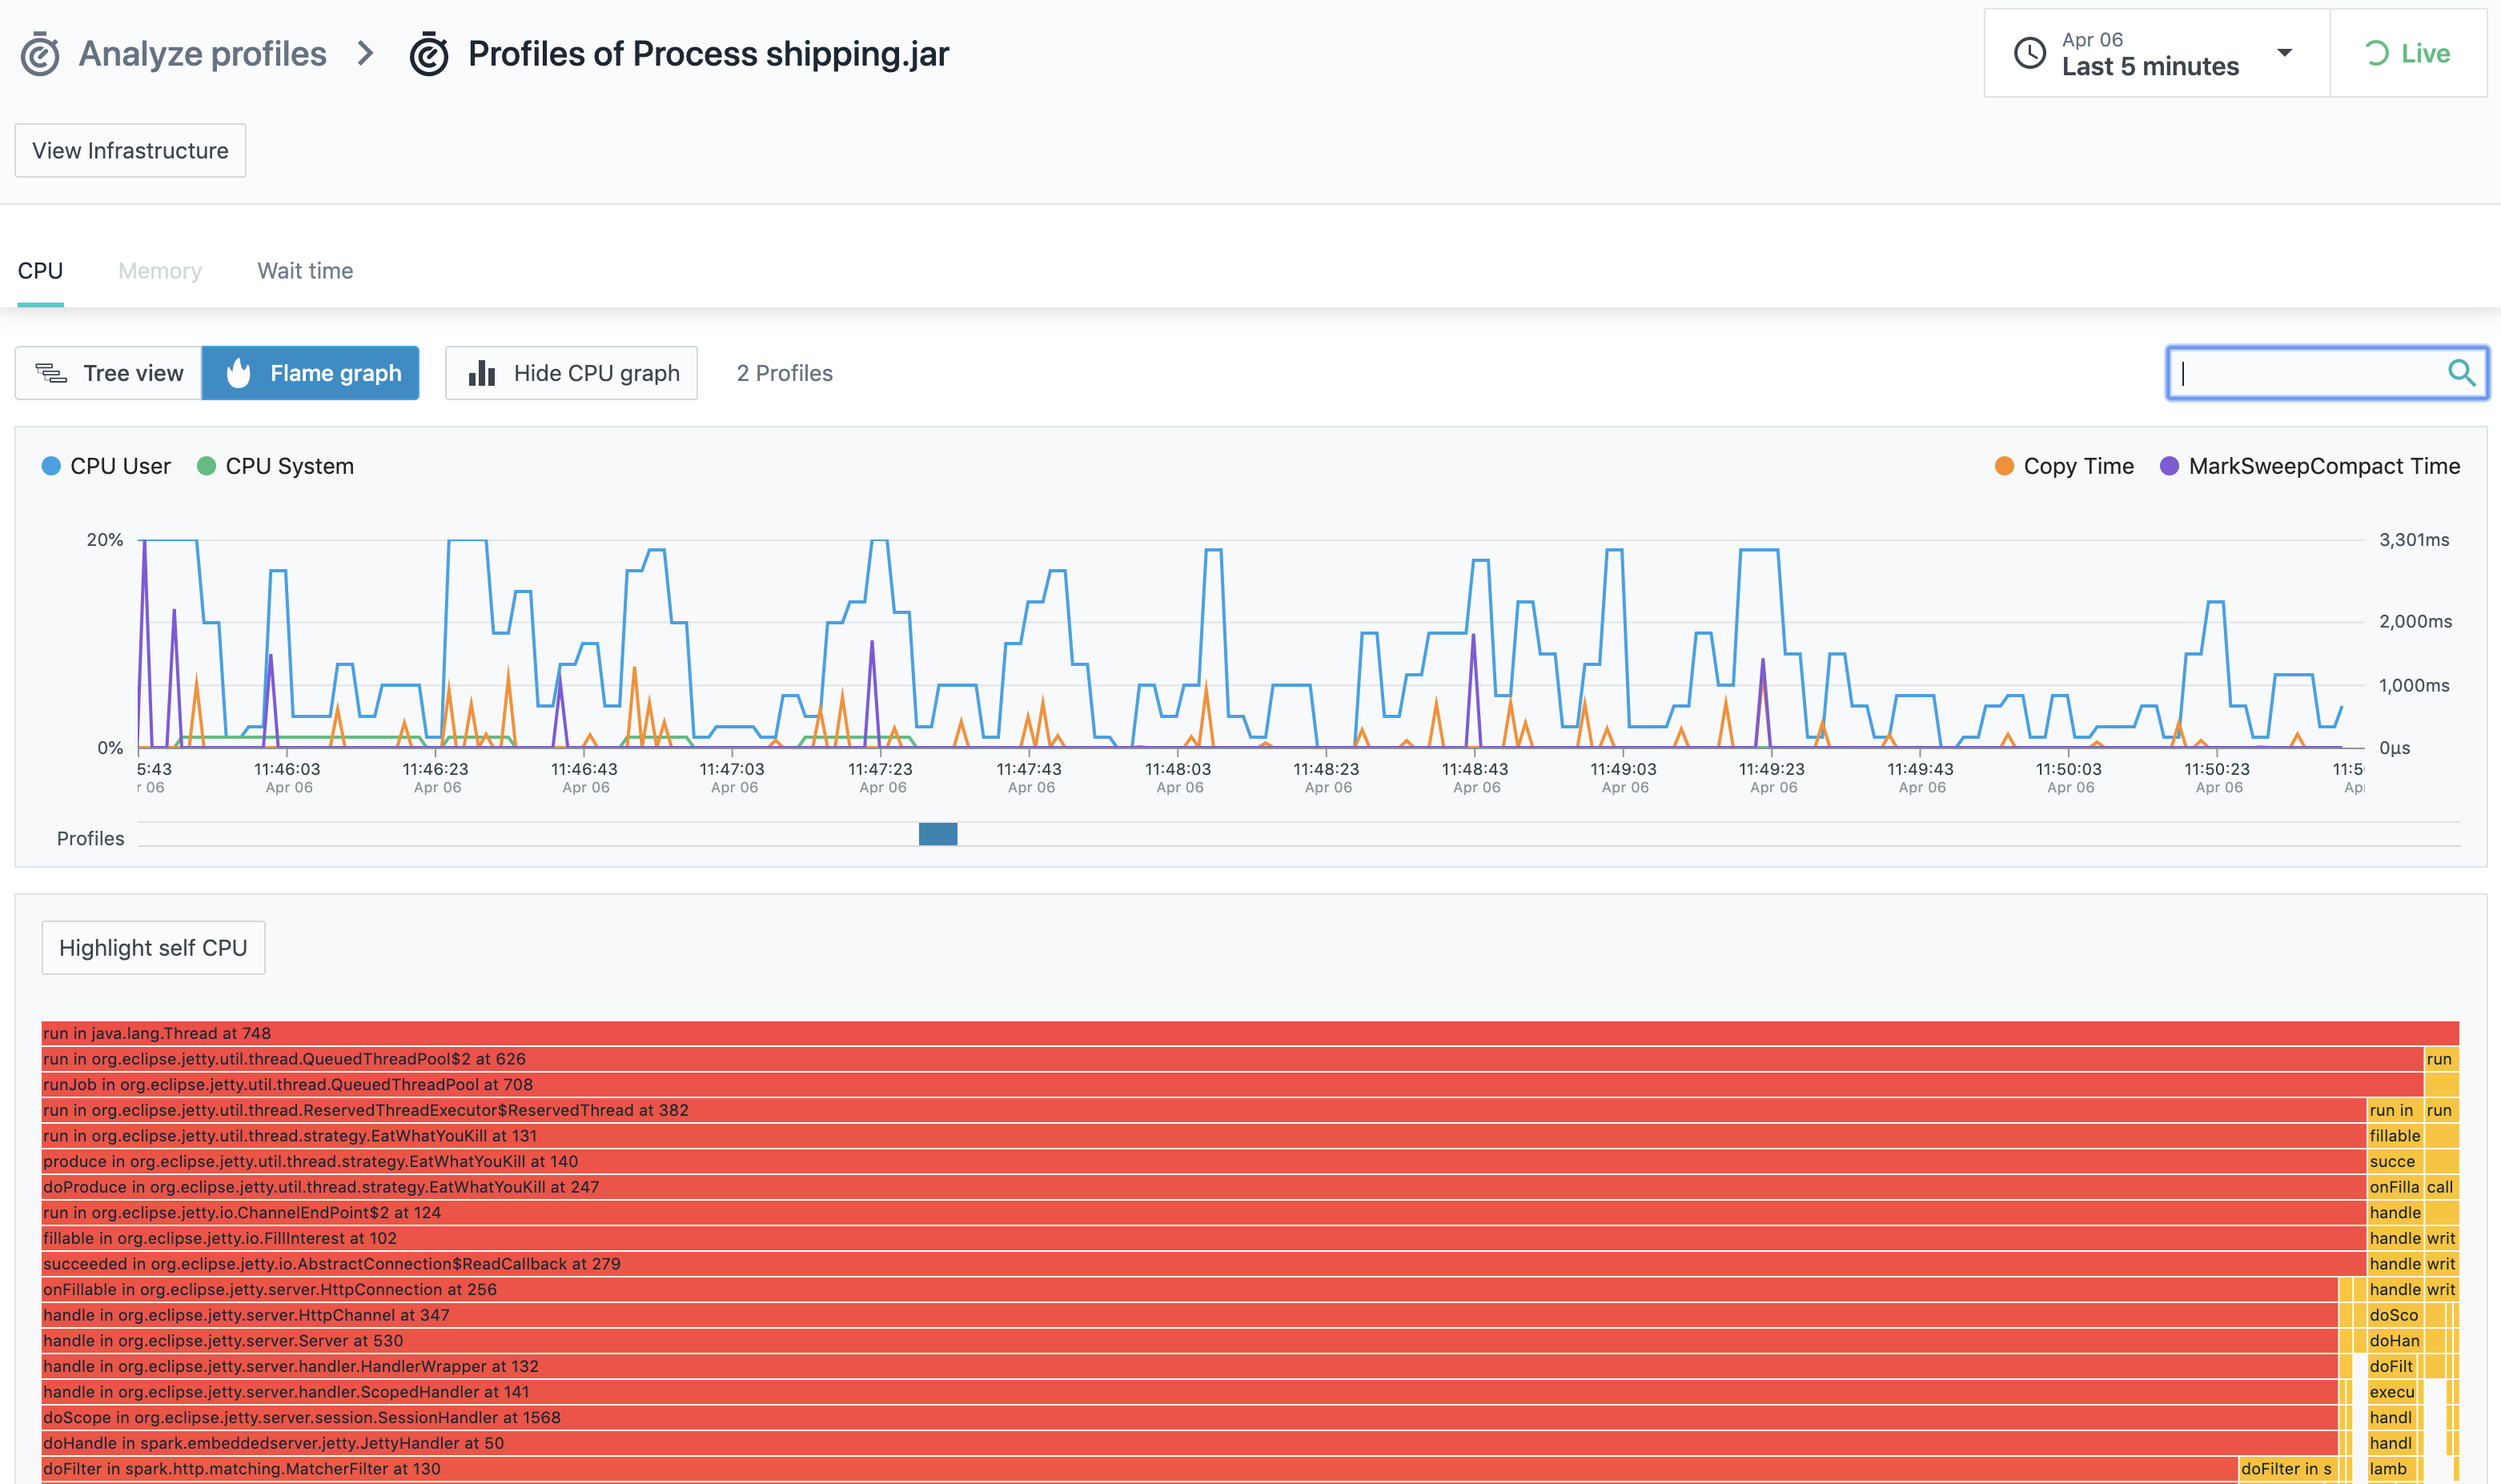
Java CPU Flame Graph for Specific Profile
Instana Pipeline Feedback with Jenkins
Visibility of an application’s dependency on the infrastructure it’s running on is a crucial aspect that should be considered. Instana integrates with CI/CD pipelines and let’s talk about what the prerequisites are and how to do it in Jenkins or any CI / CD tool that you have.
First thing first, you need to install the Instana plugin before starting the work.
Once you downloaded it, you need to create a token from settings on Instana UI within proper privileges (Configuration of Releases).
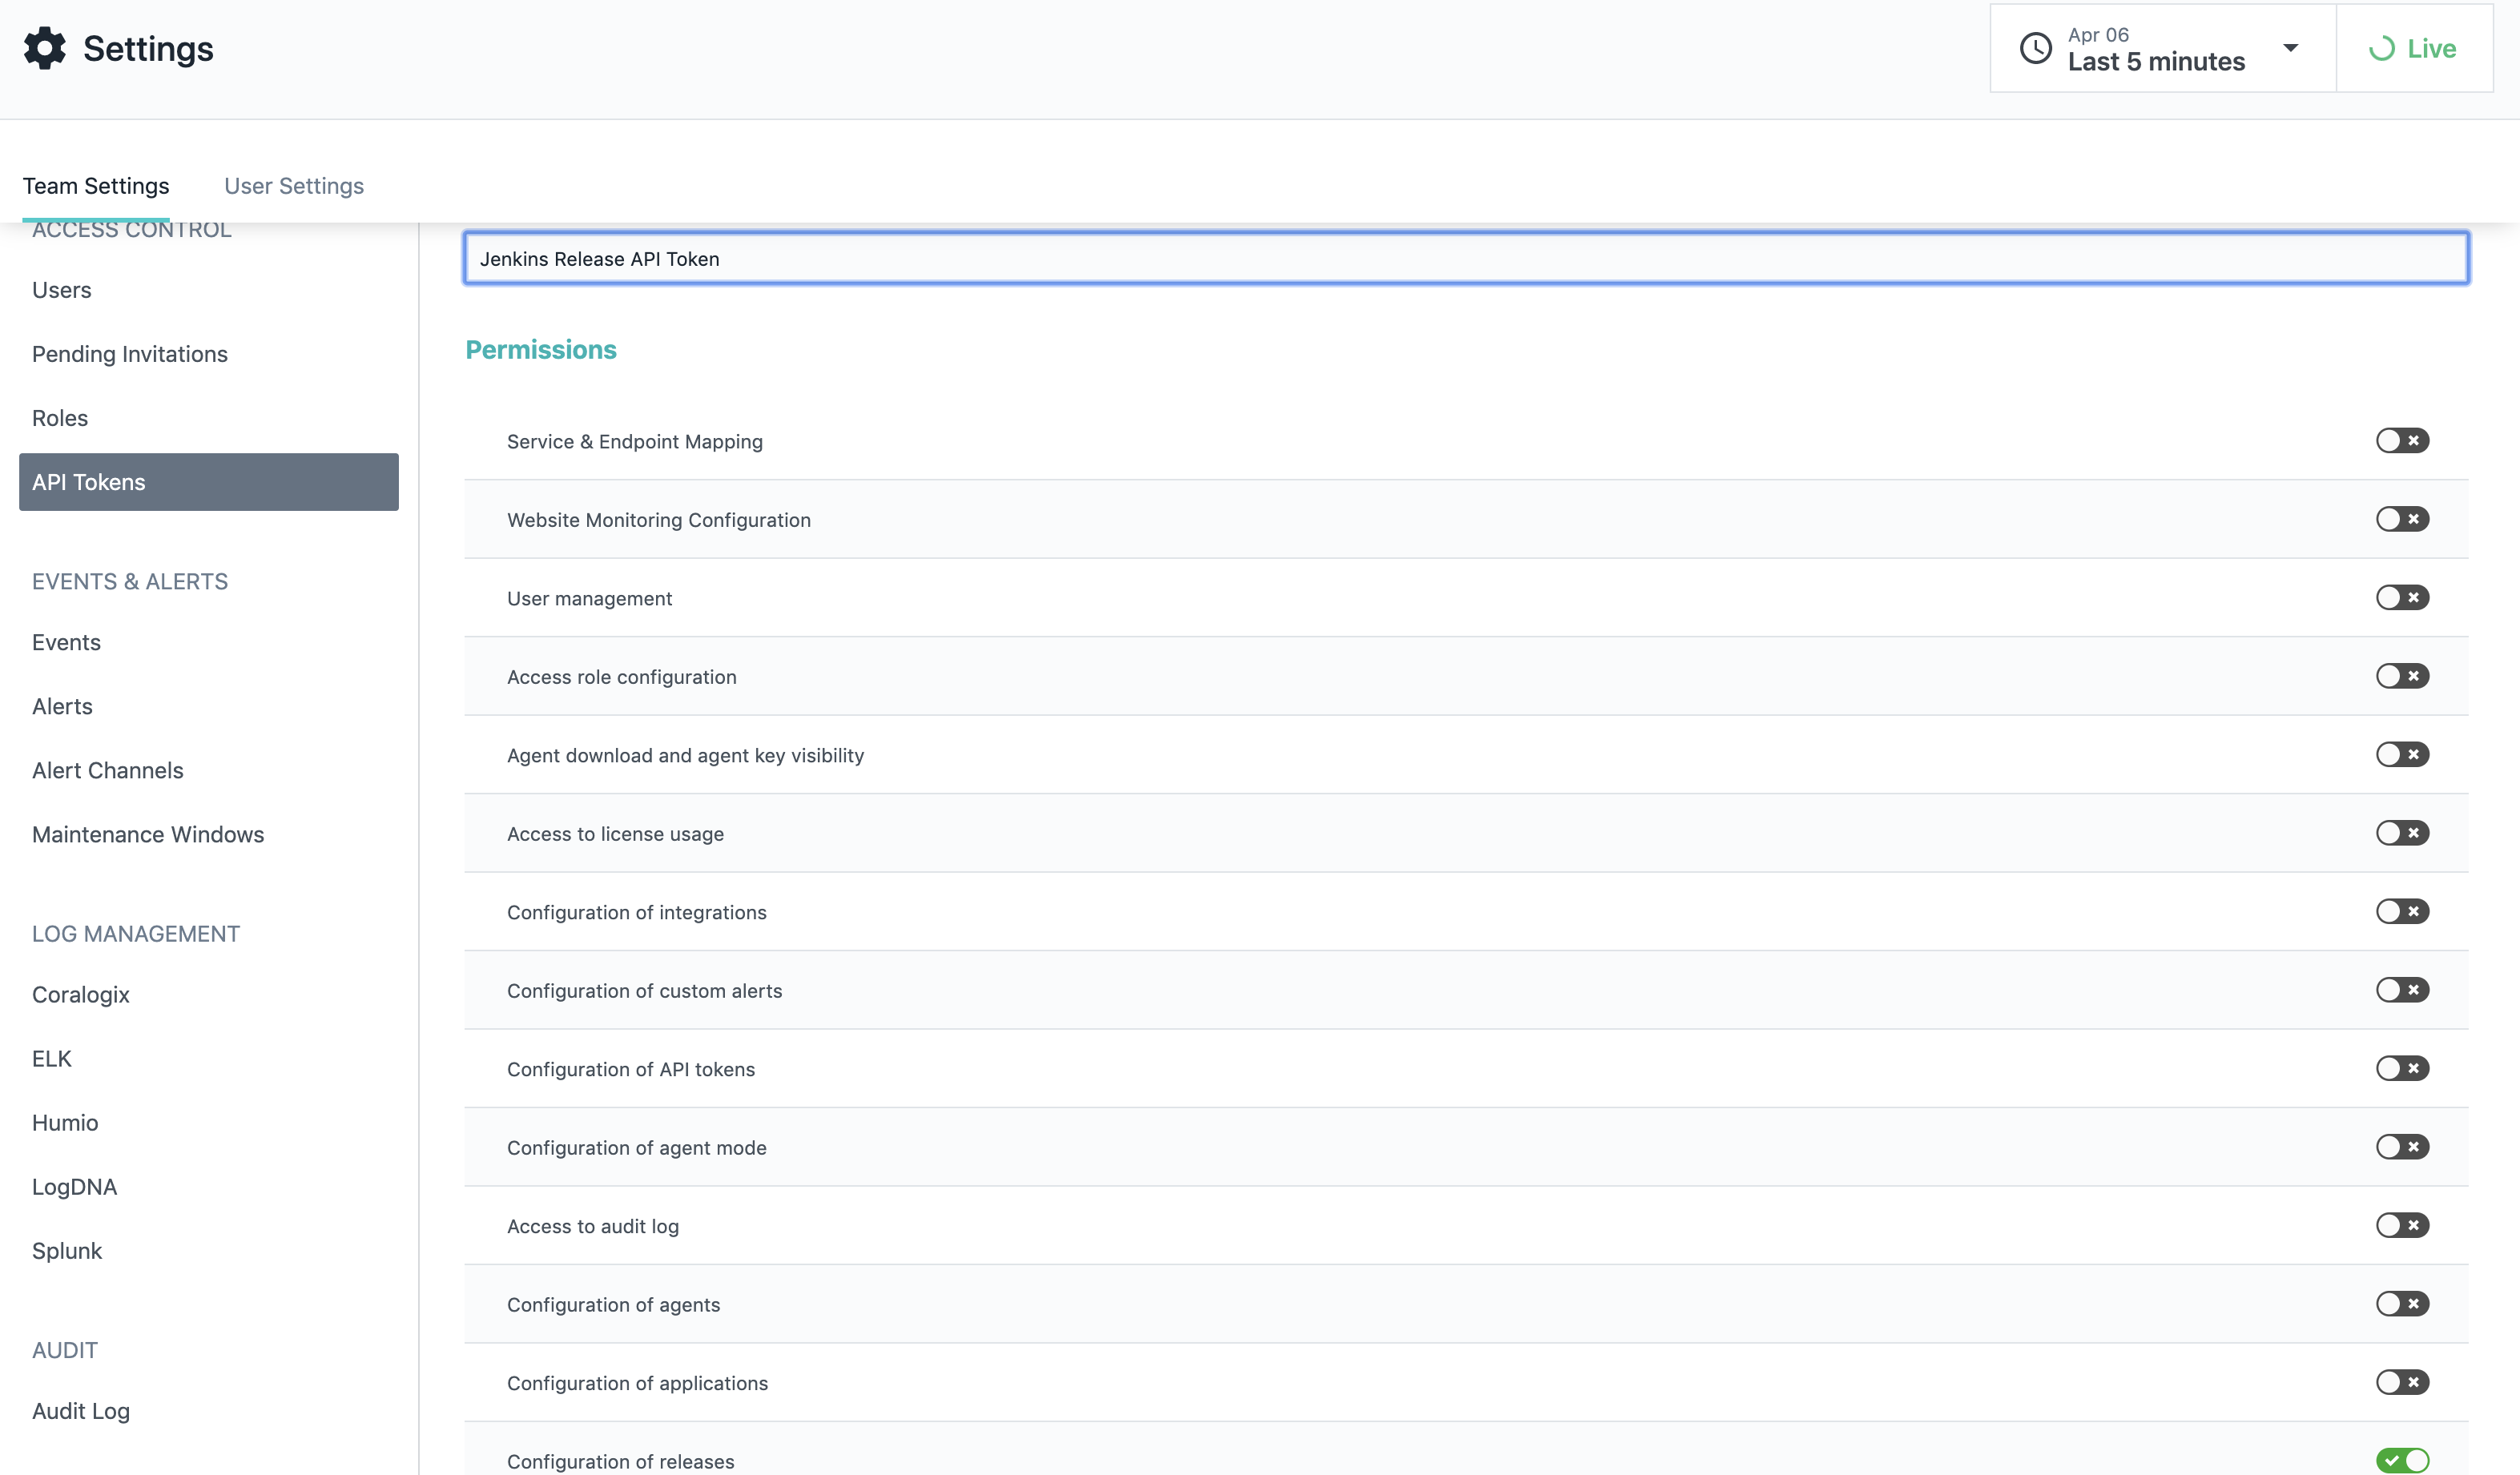
Required Permission for Instana Token
Once you created a token, you need to go Jenkins->Configure Jenkins and do your proper configurations for Instana
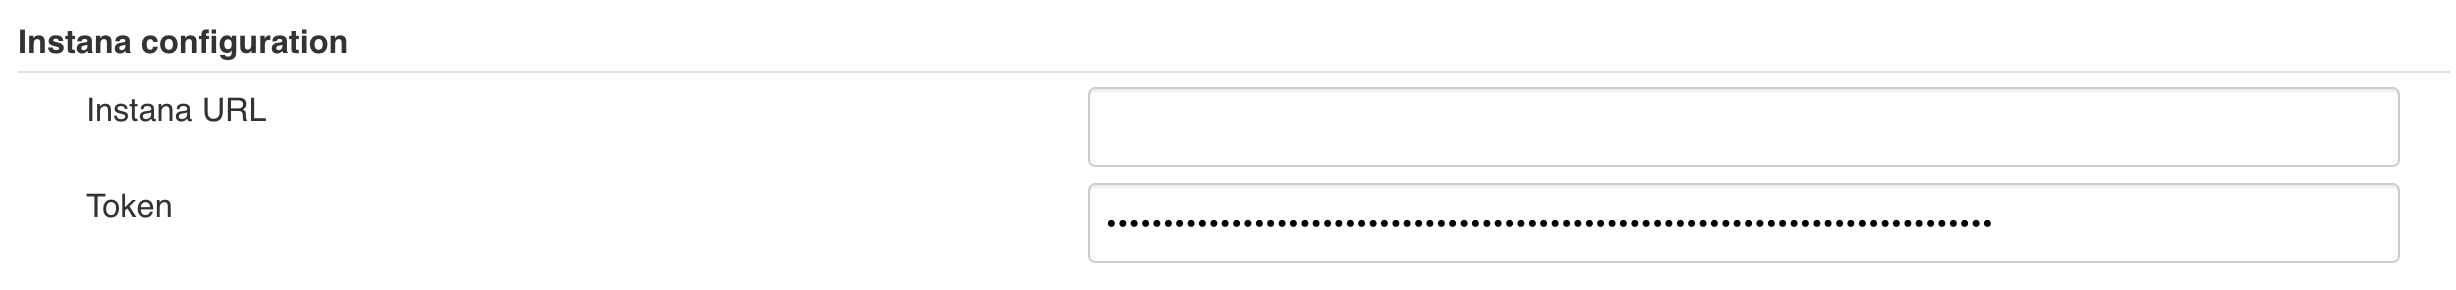
Instana Configuration on Jenkins
As a final step, you just need to make a call to Instana after your successful deployments. Here is an example of a partial Jenkinsfile that is calling the releaseMarker plugin. Release marker creates a deployment marker on all the dashboards on Instana that we are going to monitor our performance improvements and the increase in error rates. In other words, it shows the effects of the deployment on our application performance and infrastructure stability.
post('Update Slack') {
  success {
    script {
      def versionNumber=VersionNumber versionNumberString: 'release-${BUILD_DATE_FORMATTED, "ddMMyyyy"}-${BUILDS_TODAY}'
      if(params.environment=="production") {
        slackSend (channel: 'live_deployments', color: '#00FF00', message:"*LIVE*-Release for ${component} finished\nCommit: ${GIT_COMMIT}\n(<${env.BUILD_URL}|Open>)")
        releaseMarker releaseName: "Backend ${params.environment} ${versionNumber}"
      }
      else {
      slackSend (channel: 'qa_automation', color: '#00FF00', message:"*${params.environment}*\nDeployed *${branch}* to ${env.JOB_NAME}\n(<${env.BUILD_URL}|Open>)")
      }
    }
  }
}
Partial Jenkinsfile as an Example
The thing is, you don’t have to use Jenkins in your CI/CD pipeline at all! What you need is a POST request to Instana API.
curl --location --request POST "/api/releases" \
     --header "Authorization: apiToken " \
     --header "Content-Type: application/json" \
     --data "{
       \"name\": \"My First Release\",
       \"start\": 1565610536335
     }"
Basic Curl command for Using Release Marker
Final Thoughts and Closing Notes
Based on my consulting experience on cloud and DevOps, I realized that application containerization/modernization is the new direction for technology departments and every team has to keep up with that for every aspect. For example, if you are evolving from a monolith to a microservice architecture or from VMs to containers, you have to be ready for new changes ahead. Every component in your infrastructure should be designed for the new era, and I believe Instana is one of the products in the IT sector that is ready for the now and the future!
For more details you can visit https://www.instana.com .