This blog post is the successor of the HPA blog post my colleague Furkan published. We will go more deeper into HPA and will see what’s really inside of it. We will also explore what we can do with it at a more advanced level.

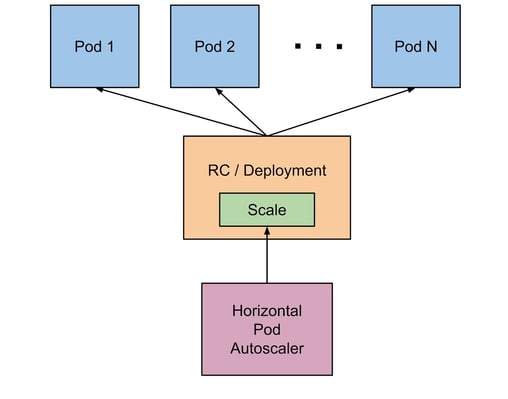
Let’s remember what HPA, Horizontal Pod Autoscaler, does:
- Scaling-in and scaling-out of the pods.
- Scaling based on kubernetes-native metrics like CPU/RAM, as well as custom metrics like thread-count.
Although those fundamental functions serve most use-cases, if we are aware of what can be done more with HPA, we can find better solutions for our problems.
Let’s start with internals
HPA has an algorithm that looks like this:
desiredReplicas = ceil[currentReplicas * ( currentMetricValue / desiredMetricValue )]
What does this mean? Let’s break it down!
desiredReplicas: Replica count that will be sent to the controller after calculations.
ceil(): This is a function that rounds a fractional number upwards. For example ceil(12.18) is 13.
currentReplicas: Current number of pods for a given deployment or any other superset of “scale” object type.
currentMetricValue: Current value of metric for a given scaling factor metric. Can be 800m or 1.5Gi, for custom metrics it can be 500 events per second etc.
desiredMetricValue: Metric that has been set to comply by HPA. Eventually with all mechanisms HPA provides, your app runs at this metric value. This value should not be too low or too high.
Let’s go over an example first. I know it is simple math but we will dive into the philosophy of the formula and we need an example first.
Let’s say we have an HPA configuration with a target CPU usage of 60%, a minimum pod count of 5 and a maximum pod count of 14.
Current deployment status is: 8 pods averaging %70 usage.
desiredReplicas = ceil[8*(70/60)] = ceil(9.33) = 10
This is what’s happening under the hood
- Control loop checks HPA usage with a period controlled by the controller manager's “--horizontal-pod-autoscaler-sync-period” flag (with a default value of 15 seconds).
- Calculation above happens.
- If “currentMetricValue/desiredMetricValue” is too close to 1, scaling doesn’t happen. This closeness can be set via the “--horizontal-pod-autoscaler-tolerance” flag (with a default value of 0.1 seconds). So, little spikes won't result in unnecessary scaling.
- If the result is a downscaling operation, then you can only downscale within a period controlled by the “--horizontal-pod-autoscaler-downscale-stabilization” flag (with a default value of 300 seconds). If this is a scale up operation then it can happen right away.
- Scaling happens. How this happens can be controlled by the “behavior” field with 1.18, v2beta2 API. We will discuss this later on.
Uncommon cases that affect scaling calculations
- If pods are shutting down:
Pods that are shutting down are discarded from calculations. Pods are considered shutting down if they have a deletion timestamp set. It looks like this:apiVersion: v1
kind: Pod
metadata:
creationTimestamp: "2020-10-27T14:00:05Z"
deletionGracePeriodSeconds: 30
deletionTimestamp: "2020-10-27T14:00:39Z"
- If pods are failing:
Failed pods are discarded from calculations. A pod is considered failed if the status object’s phase is Failed. - If pods are not ready:
A pod is considered using 0% of the resources defined in desired value if it is considered not ready. Pod is considered not ready if currently not ready or the latest metric of the pod came from while pod was not ready.
HPA can’t know if the pod became ready for the first time or became not ready and became ready again. This information is required because initial readiness and not readiness might be false. This configuration can be controlled by the “--horizontal-pod-autoscaler-initial-readiness-delay” flag (with a default value of 30 seconds). - If pods are ready but the metrics are missing:
Pods that have no metrics available are considered using 100% of the desired value for scaling down operations, 0% for the scaling up operations. Pod metrics are skipped after the pod starts. This period can be set by the “--horizontal-pod-autoscaler-cpu-initialization-period” flag (with a default value of 300 seconds).
Example
Let’s say we have an HPA configuration with a target CPU usage of 60%, a minimum pod count of 12 and a maximum pod count of 16.
Current deployment status is: There are 14 total pods. 10 pods averaging %85 usage. 2 pods are failing. 2 pods are ready but not sending metrics for a while.
This is how calculations are different from the first example calculations:
- Formula is applied on all normal pods.
desiredReplicas = ceil[10*(85/60)] = ceil(14.16) = 15 > 14 - It seems like a scaling up operation, so we can continue. If this calculation shows that no scaling is necessary, then we would stop here before calculating remaining pods in.
- Failed pods and not ready pods are always 0% of the desired value.
Now average is [(10*85)+(2*0)]/12. - Pods that have been ready but missing metrics are considered at desired usage for scaling up operations (Note that this is also 0% for scaling down operations).
Now average is [(10*85)+(2*0)+(2*60)]/14 = 69.28
desiredReplicas = ceil[14*(69.28/60)] = ceil(16.16) = 17 > 14
- Operation was scaling up, end result is still scaling up. Then scaling happens. If these calculations were reversing the scaling direction, then operation would be aborted entirely.
- HPA still shows 85% average usage because scaling calculations after first calculation only affects scaling.
- Only 2 more pods are created since the maximum number of pods is 16.
We saw how we can set scaling options with controller-manager flags. Since Kubernetes 1.18 and v2beta2 API we also have a behavior field. With the behavior field, we can configure all of these parameters on a per HPA object basis.
Full YAML example for new v2beta2 API
apiVersion: autoscaling/v2beta2
kind: HorizontalPodAutoscaler
metadata:
name: example-deployment
spec:
scaleTargetRef:
apiVersion: apps/v1
kind: Deployment
name: example-deployment
minReplicas: 1
maxReplicas: 10
behavior:
scaleDown:
selectPolicy: Disabled
scaleUp:
stabilizationWindowSeconds: 120
policies:
- type: Percent
value: 10
periodSeconds: 60
- type: Pods
value: 4
periodSeconds: 60
selectPolicy: Max
metrics:
- type: Resource
resource:
name: cpu
target:
type: Utilization
averageUtilization: 50
status:
observedGeneration: 1
lastScaleTime: <some-time>
currentReplicas: 1
desiredReplicas: 1
currentMetrics:
- type: Resource
resource:
name: cpu
current:
averageUtilization: 0
averageValue: 0
Let’s break this down and examine fields that we have already discussed:
behavior: This field is a declarative way to configure the scaling behavior.
selectPolicy: This field is used to select the preferred policy dynamically. Default value is “Max”. Not a mandatory field. Can be set to “Disabled” which disables the defined scaling operation entirely.
scaleDown, scaleUp: These fields represent scaling up or down operations, they have the same configurations.
policies: This field represents how scaling actually happens. This is an array-based field.
type: This field represents the type of the value for a given policy.
value: This field represents the value of the type for a given policy.
periodSeconds: This field represents the period between scaling operations for a given policy.
Let’s examine the example about fields above before we look at remaining fields:
behavior:
scaleDown:
selectPolicy: Disabled
scaleUp:
stabilizationWindowSeconds: 120
policies:
- type: Percent
value: 30
periodSeconds: 60
- type: Pods
value: 7
periodSeconds: 60
selectPolicy: Max
- As we can see, the “selectPolicy“ field of scaleDown field is set to “Disabled”. This means that this HPA object will never lower the number of running pods for a configured Deployment(or any other superset of the “Scale” object).
- The “stabilizationWindowSeconds” field is set to 120 seconds. The counterpart of this could be set with this controller-manager flag:
“--horizontal-pod-autoscaler-downscale-stabilization”. Setting in the “behavior” field overrides the flag value for the configured object. But scaling up has no delay. With this, we can actually set a cooldown period for scaling up operations. This could make your application’s random spikes more stable for the infrastructure. - The “type” field can be both “Percent” or “Pods”. Percent means scale by percent of the current pods. Pods means scale by “x” amount of pods. The “value" field is the numeric value of the type.
- The “selectPolicy“ field of scaleUp field is set to “Max”. This means that maximum value between policies is applied.
Let’s have a quick example: We have 18 pods available and we need lots of pods. First let's calculate 30% of the 18 pods, the answer is 5.4 but it will be rounded up to 6. Other option is straight up 7. Since selectPolicy is “Max” the deployment will be scaled by 7 pods. Now we need to wait 60 seconds before any scaling up operations can happen because periodSeconds is set to 60.
Now we have 25 pods and let’s say we still need to scale up by a large amount. Let’s calculate 30% of the 25 pods, the answer is 7.5 and it will be rounded up to 8. Other option was static which is 7. Since selectPolicy is “Max” we will scale by 8 pods this time.
Remaining important fields of the HPA object:
scaleTargetRef: This configuration block sets up HPA’s target object. This can be Deployment, replicaSet, replication controller or custom resources that are built upon the Scale object. This is why you need to provide apiVersion and kind, not just name.
metrics: This configuration block sets up the type of the metric and when should target object scale.
Let’s examine a detailed example for this:
metrics:
- type: Resource
resource:
name: cpu
target:
type: Utilization
averageUtilization: 50
- type: Pods
pods:
metric:
name: packets-per-second
target:
type: AverageValue
averageValue: 1k
- type: Object
object:
metric:
name: requests-per-second
describedObject:
apiVersion: networking.k8s.io/v1beta1
kind: Ingress
name: main-route
target:
type: Value
value: 10k
- By default there is only a “resources” type metric and only values for resource names are “cpu” and “memory”. Moreover, only target types are “Utilization” and “AverageValue”.
- You can use custom metrics by using them with a metric name and type “Pods” or describing a target object with a type “Object”. “Pods” type only allows raw values and gets the average between targeted pods. “Object” type also only allows raw values but this time the actual metric is used as opposed to the collecting average value between pods.
- If two or more metrics are defined for an HPA object, then the highest number of pods needed for “Deployment” will be used after the calculations.
Custom metrics in HPA
As we seen above, you can use custom metrics directly in the HPA configuration. This means custom metrics are first class citizens in HPA. Let’s dive into internals.
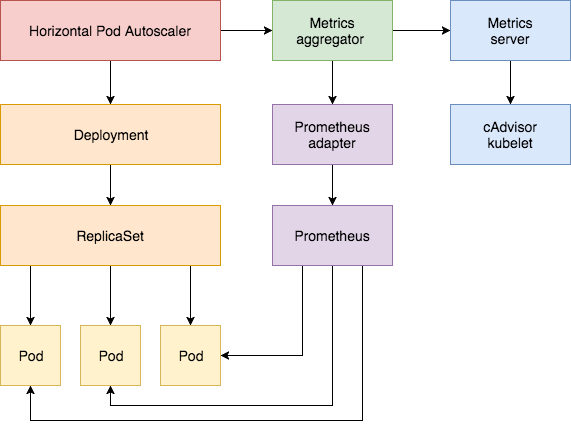
Metrics aggregator is a pathway for all the metrics server implementations. It can query metrics from a series of aggregated APIs: “metrics.k8s.io”, “custom.metrics.k8s.io”, and “external.metrics.k8s.io”. This means that if you provide an adapter that implements these APIs, you can use your metrics provider.
The most common metric provider is indeed “metrics-server” which is not included with Kubernetes natively. This application is implemented with “metrics.k8s.io” API. You can think of it as the default provider for CPU and memory metrics.
We will not do a Prometheus example but as you might understand by now, it is just an implementation over an abstraction and won’t change how HPA works by any means. If you want to implement a Prometheus based HPA solution, there are many great blog posts about this matter. There is also a great blog post about this in the “suggested reads” section.
Main takeaways from HPA philosophy
- Stability: HPA will always keep your system/app as stable as possible. This means that if scaling up is not feasible for the system, then the current state will be preserved. If scaling down happens frequently, then HPA will slow down the scaling process in order to accommodate the likelihood of a new surge of traffic. HPA will try to make the pod number as high as needed in case of application bottlenecks.
- Extensibility: HPA will always be open to extensibility by metrics means or scaled object type. These are first class citizens in HPA.
- Sensible defaults: HPA is built upon great defaults for common usage. You don’t really need to change defaults and use them as they are.
- Configurability: HPA can be configured by controller-manager’s flags or on a per object basis. Nearly all of the settings can be reconfigured to reflect specific needs.
- Being not error prone: If target Pods or metrics providers don't send metrics for a while, HPA’s ways of reconciling are great. Moreover, HPA will try to collect metrics when metrics are as stable as possible. We discussed these ways in this blog post.
Conclusion
I tried to demystify HPA as much as possible. I did this because I learn better if I know the internals as much as possible. I tried my best to provide examples and graphics to appeal to more people with different types of learning process.
Another advanced area worth exploring is the extensibility part of the HPA, which means implementing custom “Scale” based custom resources or implementing custom metrics and scale based upon those metrics.
Suggested reading: