×
Instana is a Kubernetes-native APMv(Application Performance Monitoring) tool which is built for new-stack including Microservices and lately Serverless but also supports the existing VM based stacks including several supported technologies.
Instana's automated monitoring approach sets it apart from traditional APM tools. The platform automatically discovers and maps your entire technology stack without manual configuration.
Auto discovery works across multiple layers. It starts at the infrastructure level, moves through hosts and containers, and extends to application components. This means you don't need to spend hours configuring agents or mapping dependencies manually.
Once discovery completes, Instana creates visual maps of your architecture. These maps update in real-time, showing how services connect and communicate. The platform automatically detects new services as they deploy, making it perfect for dynamic environments where applications change frequently.
Instana captures performance data every single second. Most APM tools sample data to reduce overhead, but this creates gaps in visibility. When issues occur between sampling intervals, other tools miss them entirely.
With one-second granularity, Instana catches performance problems the moment they happen. This matters most during brief spikes or intermittent issues that traditional monitoring misses. Teams can see exactly what happened and when, making troubleshooting faster and more accurate.
The platform maintains this level of detail without consuming excessive CPU resources. Only in rare cases where you set specific CPU limits might Instana reduce data collection. For most deployments, you get complete visibility without performance trade-offs.
Instana continuously learns normal behavior patterns across your applications. The built-in machine learning engine analyzes metrics constantly, establishing baselines for what's typical in your environment.
When something deviates from normal patterns, Instana automatically creates incidents. This anomaly detection happens without predefined thresholds or complex rules. The system adapts to your specific applications and workloads.
This approach brings speed to troubleshooting. Instead of sifting through thousands of metrics, teams receive alerts only when genuine problems occur. The platform highlights abnormal behavior and helps identify root causes quickly, reducing mean time to resolution.
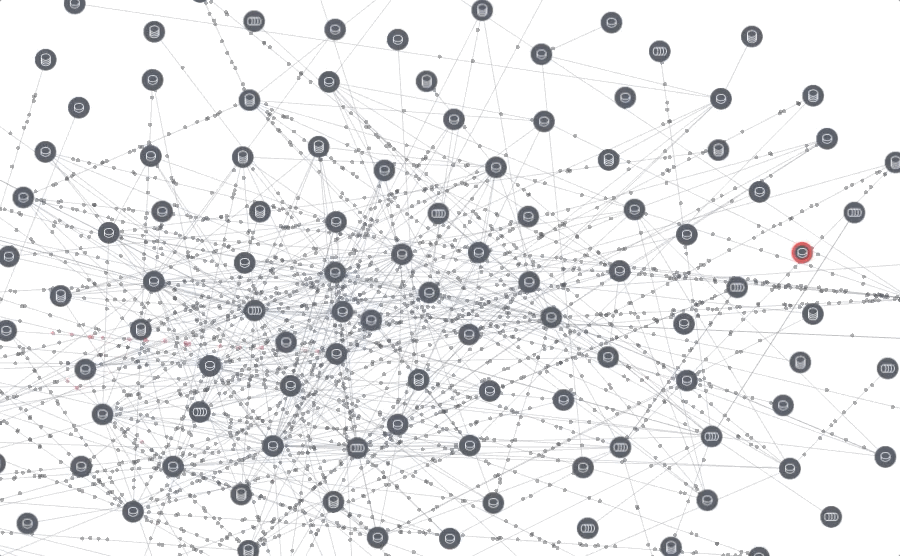
Instana generates dynamic visual maps showing your entire technology stack. These maps aren't static diagrams but living representations of your infrastructure and applications.
The visualization changes based on real-time metrics. Service icons grow or shrink depending on load, and colors shift to indicate health status. Red indicates problems, yellow shows warnings, and green means everything runs normally.
These visual cues help teams spot issues instantly. You can see at a glance which services experience problems and how issues cascade through your architecture. This visual approach makes complex distributed systems easier to understand and manage.
Instana creates visual maps of the architecture. The size and colours change based on the metrics. You can see that Instana automatically coloured on service as Red:
Any type of "Change" related to the Infrastructure, configuration, or deployment is marked in Instana and this helps the teams troubleshoot, whether the unexpected behavior(s) are happening after that Change.
Every infrastructure change, configuration update, or deployment gets marked in Instana's timeline. This change tracking creates a historical record linked directly to performance metrics.
When unexpected behavior occurs, teams can quickly check if recent changes caused the problem. The platform shows exactly what changed and when, correlating deployments with performance shifts.
This capability proves valuable for teams practicing continuous deployment. With multiple changes happening daily, knowing which deployment introduced a problem saves hours of investigation time.
Tracing becomes essential when running microservices or any distributed architecture. Instana provides comprehensive tracing that follows requests across service boundaries.
The platform includes native tracing functionality and supports CNCF OpenTracing standards. This flexibility means you can use existing instrumentation while gaining Instana's visualization and analysis features.
Each trace shows the complete path of a request through your system. You can see which services handled the request, how long each step took, and where bottlenecks occurred. Stack traces appear alongside timing data, giving developers the exact context needed to fix issues.
Instana connects with popular alert management platforms like OpsGenie. This integration centralizes your incident response workflow.
Alerts flow from Instana into your existing notification and escalation systems. Teams continue using their preferred tools while gaining Instana's detailed monitoring data. You can create escalation policies based on team structure and incident severity.
This approach prevents alert fatigue by routing notifications to the right people at the right time. Critical production issues reach senior engineers immediately, while minor warnings go to appropriate support tiers.
Instana excels in specific scenarios where its capabilities provide maximum value.
Kubernetes environments change constantly as pods start, stop, and move between nodes. Instana's auto-discovery handles this dynamism perfectly, tracking containers automatically without configuration changes.
Distributed systems with dozens or hundreds of services need comprehensive tracing and dependency mapping. Instana provides the visibility required to understand complex service interactions and diagnose cross-service issues.
Organizations running hybrid clouds, multiple platforms, or polyglot architectures benefit from Instana's broad technology support. The platform monitors diverse stacks through a single pane of glass.
Teams seeking to reduce manual monitoring tasks find value in Instana's automated approach. Installation, configuration, and alerting require minimal human intervention, freeing engineers for higher-value work.
Kloia provides Instana implementation, integration and optimization services globally, including: United States (US), United Kingdom (UK), Türkiye, United Arab Emirates (UAE), Europe & Middle East.
Our teams support organizations across different industries and cloud-native environments, delivering end-to-end Instana APM services regardless of region.