Monitoring performance metrics is always a challenge for containerized applications and microservices. When using Amazon EKS, you can use CloudWatch Container Insights for collecting, aggregating, and summarizing metrics and logs from your Kubernetes clusters.

Amazon CloudWatch is a monitoring service that monitors your AWS resources and applications in real-time. You can create custom dashboards to display custom metrics that you define. Also, you can create alarms that watch those metrics and send notifications when a threshold is reached.
CloudWatch Container Insights is a feature in CloudWatch that allows you to monitor your containerized applications. You can use Container Insights when using ECS (Elastic Container Service), EKS (Elastic Kubernetes Service), Kubernetes on EC2 and Fargate. CloudWatch automatically watches CPU, Memory, Disk, and Network metrics. With Container Insights, you can also collect diagnostic information from containers such as container failures, the total number of container restarts, and many more from your Kubernetes clusters.
To enable Container Insights on your EKS Clusters, you need to set up CloudWatch agent as a daemonset on your cluster to send metrics to Cloudwatch, and you need to deploy FluentD as a daemonset to send logs to CloudWatch Logs.
We have an example EKS Cluster set up with three EC2 Worker Nodes.
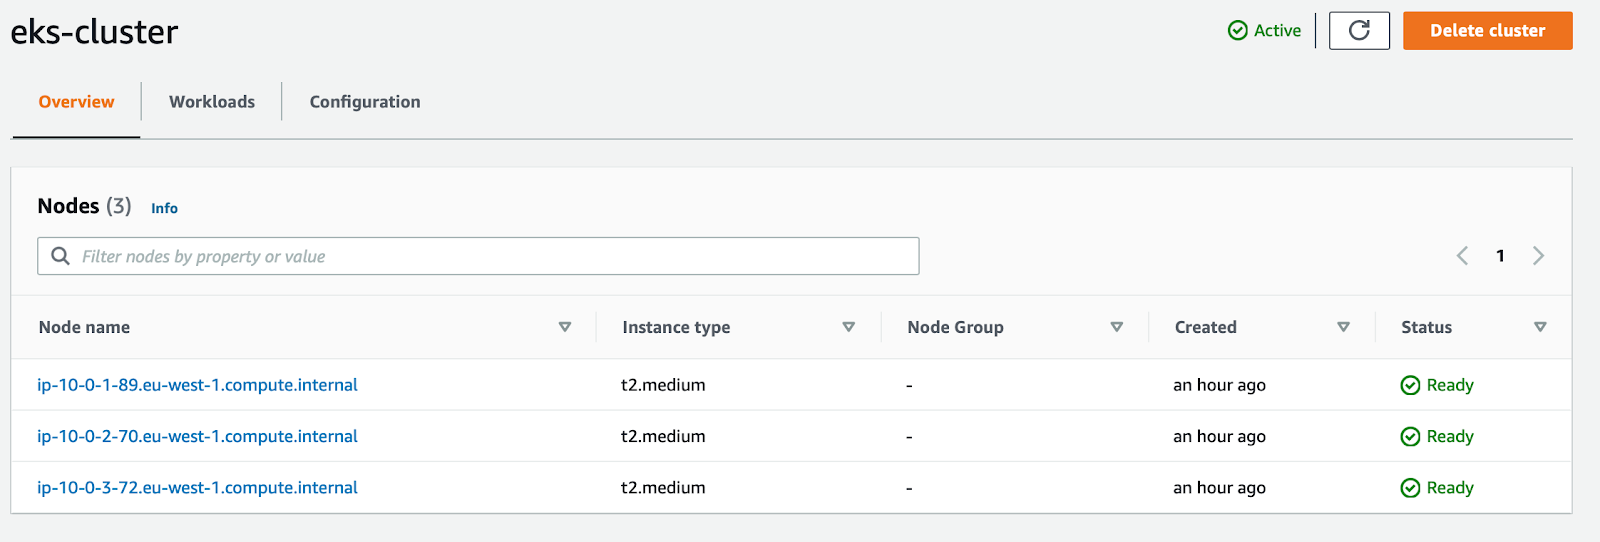
Worker Nodes
We will attach an IAM Policy to nodes’ IAM Role for enabling the Worker Nodes to send metric data to CloudWatch.

Default Policies on Worker Node IAM Role
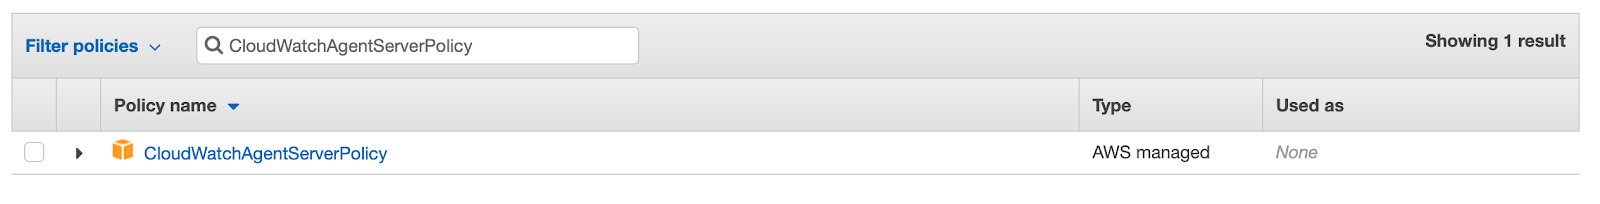
CloudWatch agent policy
You can use the IAM service account role for granting permissions. But this method only works on EKS Clusters.
After granting necessary permissions to EC2 instances from a client that has kubectl installed and have a connection to the cluster, we will deploy the CloudWatch agent and Fluent Bit to the EKS Cluster.
We need to create a namespace for these components.
kubectl create ns amazon-cloudwatch
For CloudWatch agent to collect metrics, we need to create a service account and ClusterRole and ClusterRoleBinding with following rules:
rules:
  - apiGroups: [“”]
    resources: [“pods”, “nodes”, “endpoints”]
    verbs: ["watch", "list"]
  - apiGroups: [“”]
    resources: ["nodes/proxy"]
    verbs: [“get”]
  - apiGroups: [“”]
    resources: [“nodes/stats”, “configmaps”, “events”]
    verbs: [“create”]
  - apiGroups: [“”]
    resources: [“configmaps”]
    resourceNames: [“cwagent-clusterleader”]
    verbs: [“get”, “update”]
  - nonResourceURLs: [“/metrics”]
    verbs: [“get”]
After creating Role and RoleBinding, we need to create a ConfigMap for the CloudWatch agent. Here is an example configmap definition:
apiVersion: v1
data:
  # Configuration is in Json format. No matter what configure change you make,
  # please keep the Json blob valid.
  cwagentconfig.json: |
    {
      "logs": {
        "metrics_collected": {
          "kubernetes": {
            "cluster_name": "",
            "metrics_collection_interval": 60
          }
        },
        "force_flush_interval": 5
      }
    }
kind: ConfigMap
metadata:
  name: cwagentconfig
  namespace: amazon-cloudwatch
We need to change the cluster name section, and if we want, we can reduce the metric collection interval to 15 seconds.
After creating the ConfigMap, we can deploy the CloudWatch agent as a DaemonSet to our cluster. There is an example definition file you can download and deploy to your cluster from AWS Samples:
wget https://raw.githubusercontent.com/aws-samples/amazon-cloudwatch-container-insights/latest/k8s-deployment-manifest-templates/deployment-mode/daemonset/container-insights-monitoring/cwagent/cwagent-daemonset.yaml
You can modify this file and deploy it to your cluster with
kubectl apply -f cwagent-daemonset.yaml
The last part of the deployment is Fluent Bit to sends the container logs to CloudWatch. We need to create a ConfigMag for Fluent Bit.
ClusterName=cluster-name
RegionName=cluster-region
FluentBitHttpPort='2020'
FluentBitReadFromHead='Off'
[[ ${FluentBitReadFromHead} = 'On' ]] && FluentBitReadFromTail='Off'|| FluentBitReadFromTail='On'
[[ -z ${FluentBitHttpPort} ]] && FluentBitHttpServer='Off' || FluentBitHttpServer='On'
kubectl create configmap fluent-bit-cluster-info \
--from-literal=cluster.name=${ClusterName} \
--from-literal=http.server=${FluentBitHttpServer} \
--from-literal=http.port=${FluentBitHttpPort} \
--from-literal=read.head=${FluentBitReadFromHead} \
--from-literal=read.tail=${FluentBitReadFromTail} \
--from-literal=logs.region=${RegionName} -n amazon-cloudwatchö
We need to change the ClusterName and RegionName parameters. In my case, my ClusterName is eks-cluster, and my RegionName is eu-west-1. We are specifying the namespace parameter as well. You can change the namespace according to your configuration, but it has to be the same namespace that you deployed the CloudWatch agent.
After creating the ConfigMap, we need to create a DaemonSet for Fluent Bit as well. Again there is an example definition file that you can download, modify and deploy to your cluster from AWS Samples:
wget https://raw.githubusercontent.com/aws-samples/amazon-cloudwatch-container-insights/latest/k8s-deployment-manifest-templates/deployment-mode/daemonset/container-insights-monitoring/fluent-bit/fluent-bit.yaml

kubectl apply -f fluent-bit.yaml
After completing these steps, we see six pods running on amazon-cloudwatch namespace because we have three worker nodes in our cluster, and both CloudWatch agent and Fluent Bit are running as a DaemonSet.
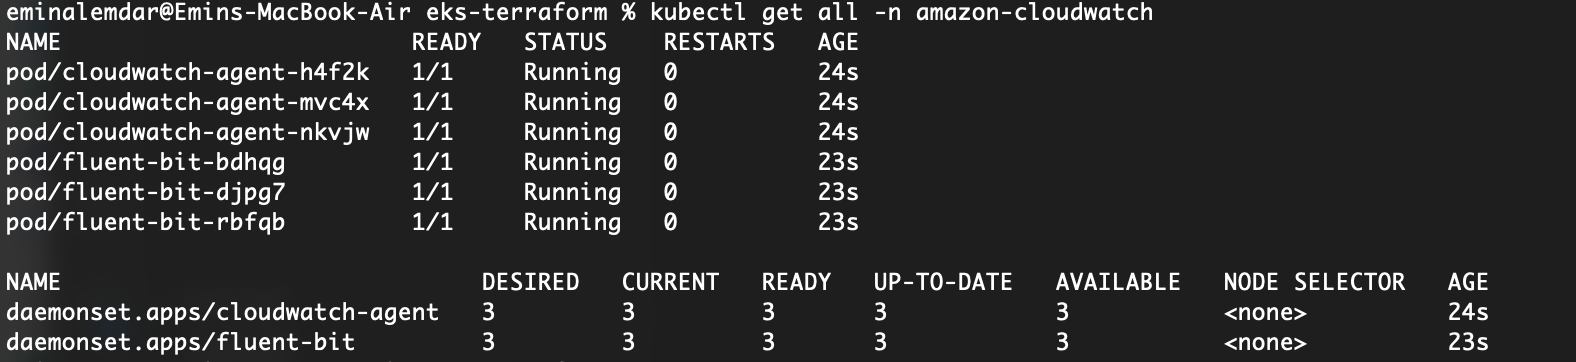
Pods running on amazon-cloudwatch namespace
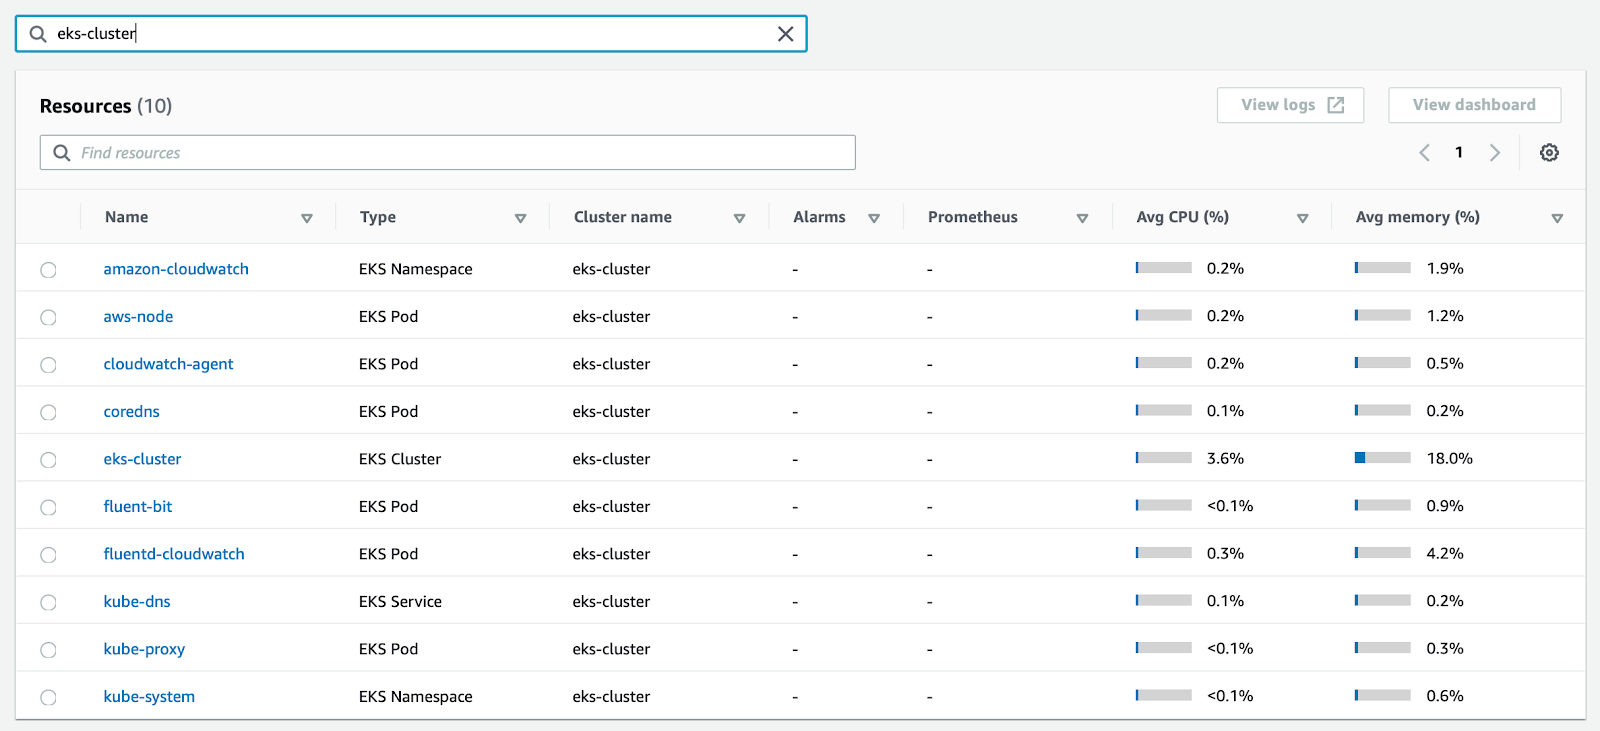
Now we can jump into the CloudWatch console to see metrics from our EKS Cluster. We can see the general resource utilization from your cluster, namespaces, services, and pods in the resources section.
Container Insights Resources Dashboard
When we jump into the Performance Monitoring dashboard, we can see the detailed metric information and graphs from our cluster components. For example, we can see our nodes’ performance graphs showing CPU, Memory, Disk, Network, and the number of pods/containers.
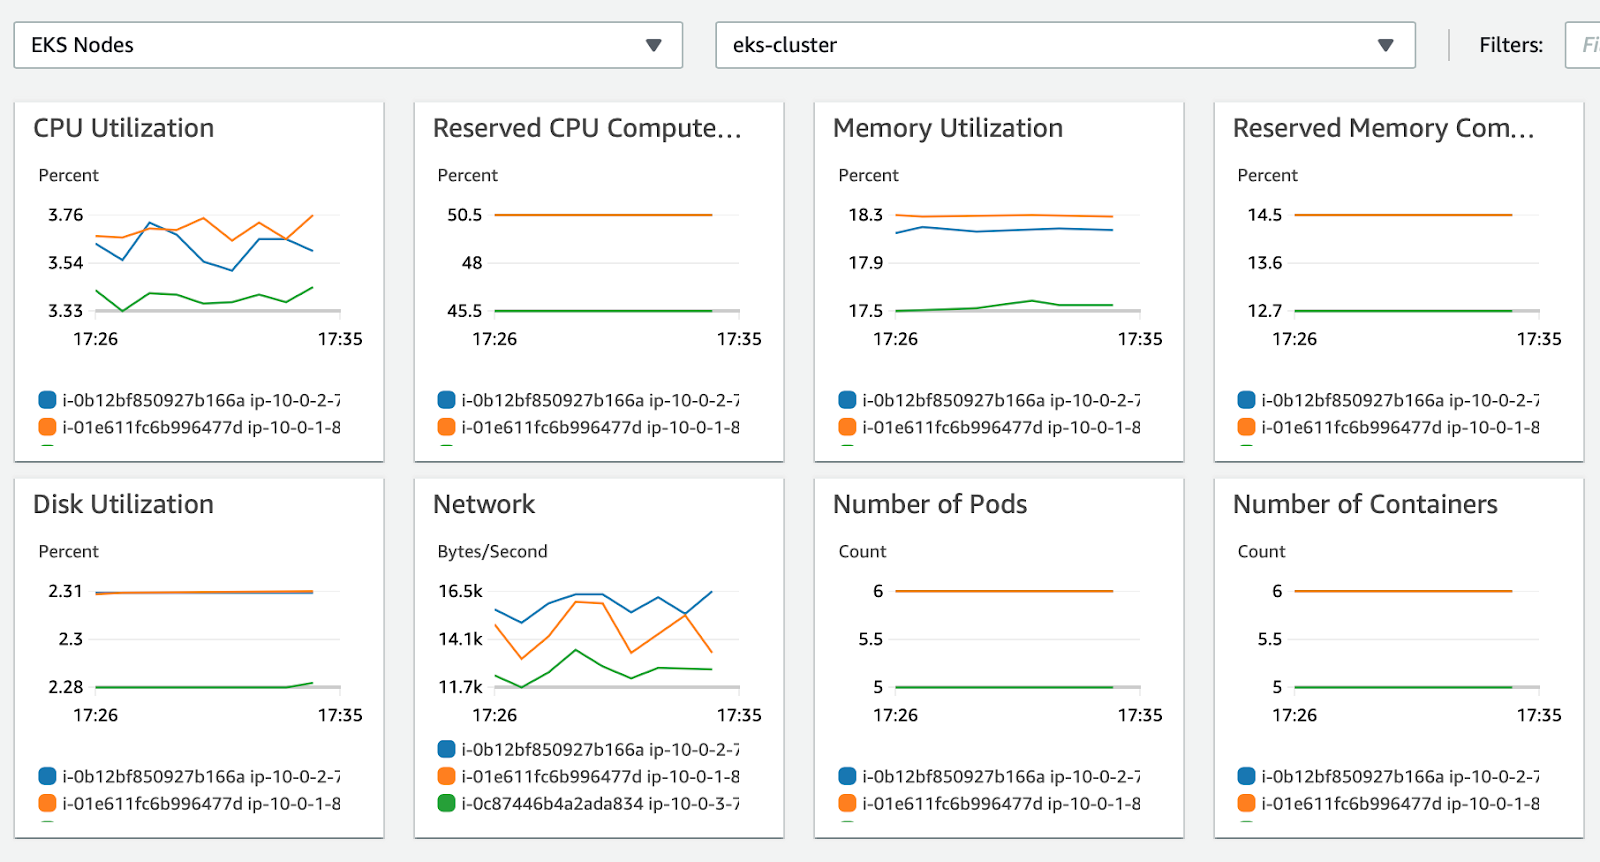
Performance Monitoring Dashboard EKS Nodes
We can also see details about services, namespaces, and pods as well.

Performance Monitoring Dashboard EKS Pods
You can filter these dashboards and create alarms for these metrics to send notifications as well.
Conclusion
Container Insights is a feature of CloudWatch that can monitor our ECS Clusters, EKS Clusters, Kubernetes Clusters running on EC2 instances, and Fargate. You can use this feature to see detailed performance metrics from your cluster components.
Suppose you are running your Kubernetes Clusters on AWS either using EKS or running your clusters on EC2 instances and currently don’t have an APM solution for getting metrics from your clusters. In that case, CloudWatch Container Insights is a quick way to monitor your cluster performance.
